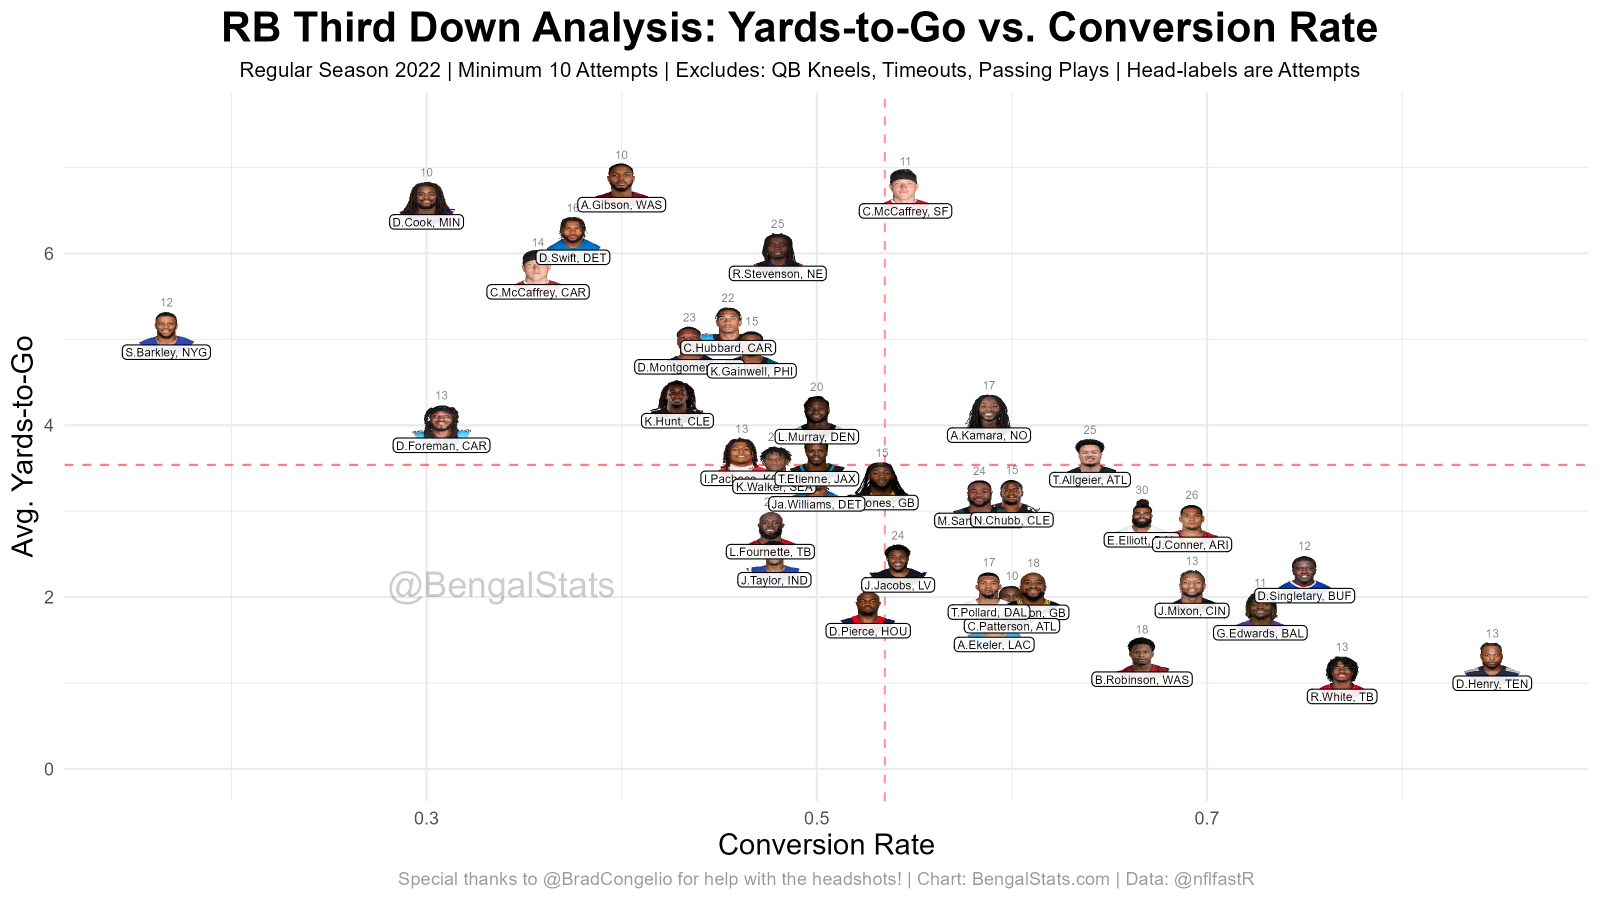
Avg. Yards-to-Go vs. Conversion Rate
Reddit user u/ssupafuzz suggested including average yards-to-go in the running back third down analysis I did last week. Fortunately, in the play-by-play data used for this analysis there is a field that shows the "Numeric yards in distance from either the first down marker or the endzone in goal down situations."
Using this field, along with two others that indicate whether a "first down was converted on third down" and "whether the team on offense failed to convert first down on third down" - I found the third-down conversion rate and mean yards-to-go for each running back, and displayed the total number of attempts as a text label above each headshot.
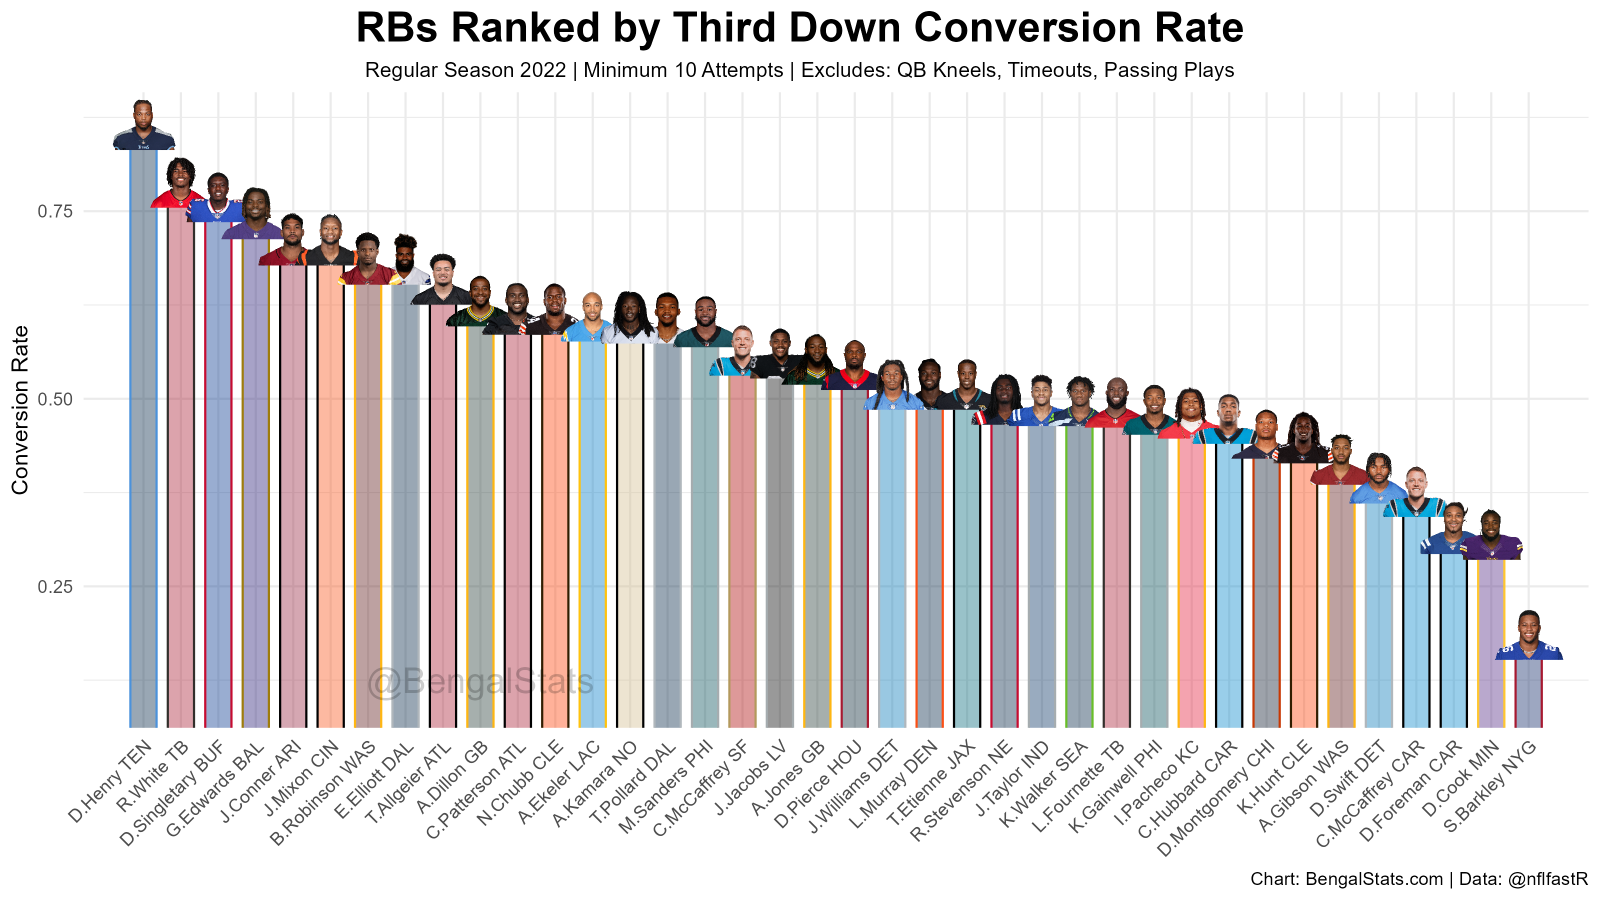
RBs Ranked by Third Down Conversion Rate
This analysis looks at play-by-play data from the 2022 NFL Regular Season. The data is filtered to consider only rushing attempts on third down, and in order to qualify the RB needed at least ten attempts. The Bengals' Joe Mixon is ranked #6. At the time of this analysis his future with the Bengals remains unclear.
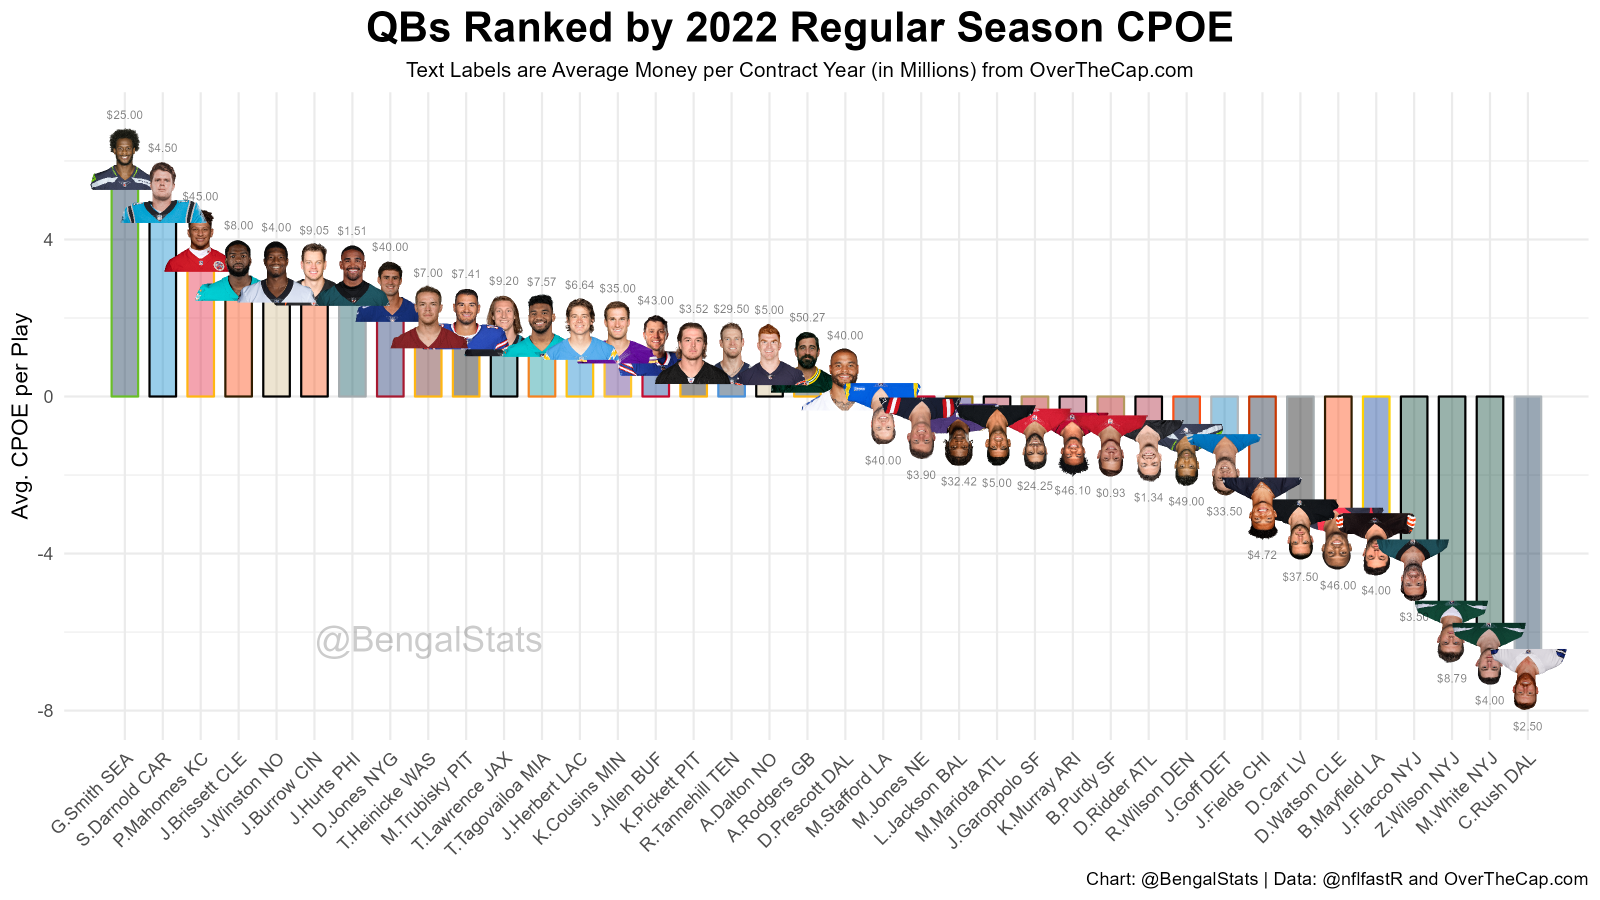
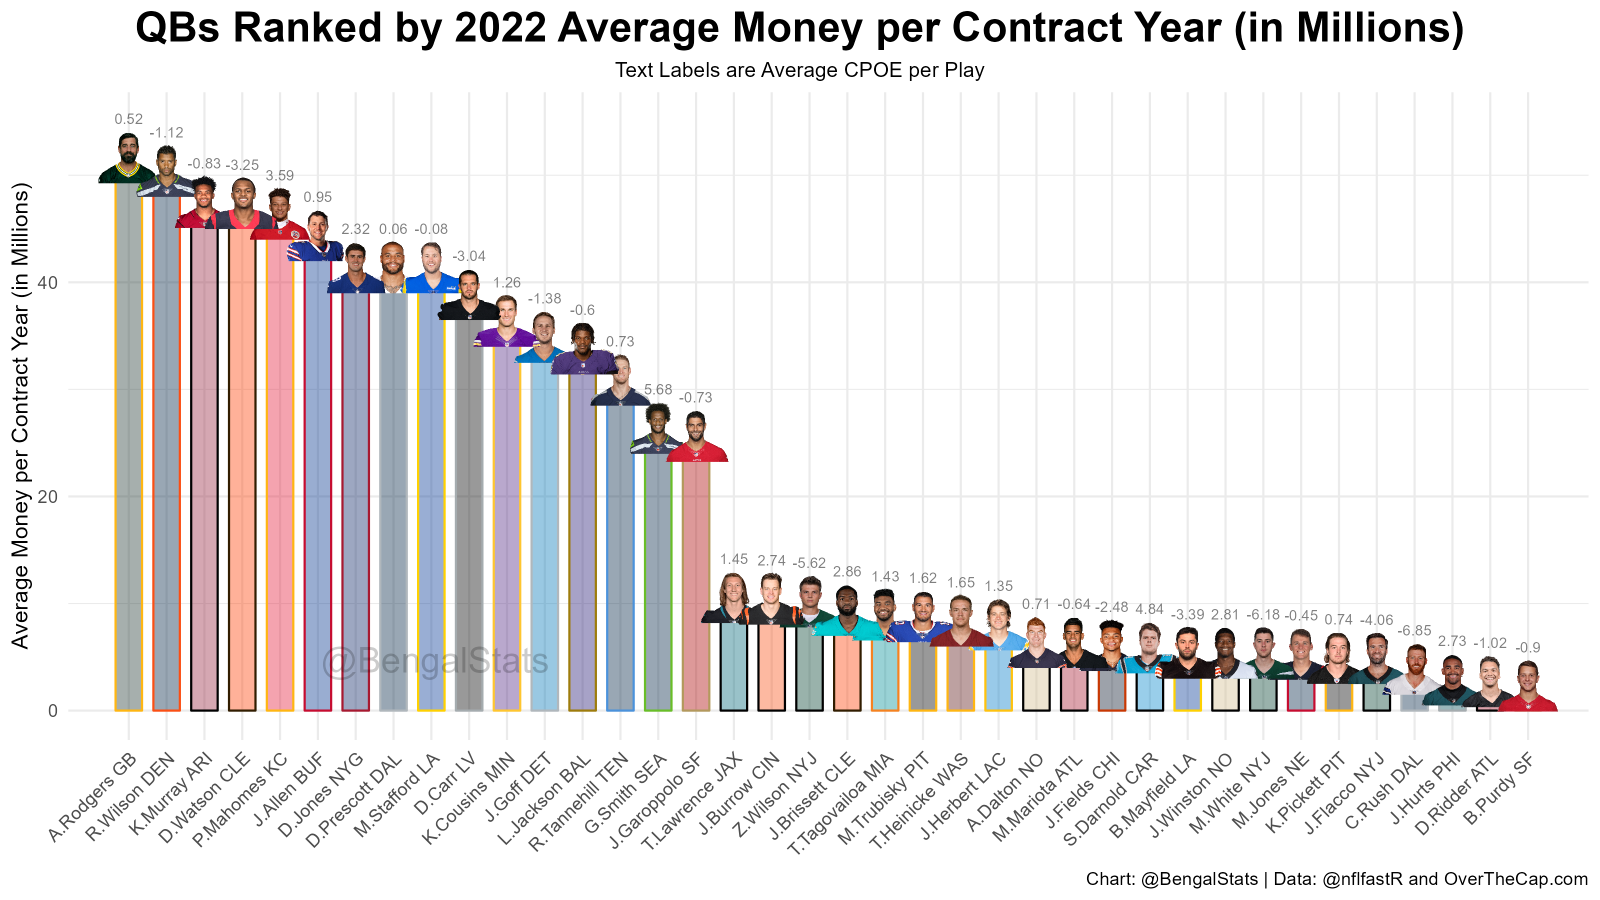
QB CPOE and APY
NFL teams need to weigh not only a player's performance but also their cost. There is a limit to how much teams can spend each year, so they have to allocate their capital carefully in order to maximize the production of each dollar spent.
The first chart shows QBs ranked by Completion Percentage Over Expected (CPOE). This metric aims to show how accurate a QB is by comparing their actual completion percentage to an expected completion percentage. The amount above the expected completion percentage is what this metric shows.
The text labels on this chart show each QB's APY (in Millions) for 2022. APY stands for "Average money per contract year", and comes from OverTheCap.com.
The second chart shows QBs ranked by APY, and really illustrates the impact of a rookie contract.
The text labels on this chart show each QB's CPOE.
WR Third Down Conversion Rankings (Total & Rate)
In order to make this list, each wide receiver needed at least 30 targets on third down passing plays during the 2022 Regular Season.
The first chart shows the total number of third down conversions on passing plays for each wide receiver.
.png)
By looking at the rate instead of the total we can take into account failed attempts, which helps to illustrate efficiency.
Keep in mind that these numbers exclude third down rushing attempts.
.png)
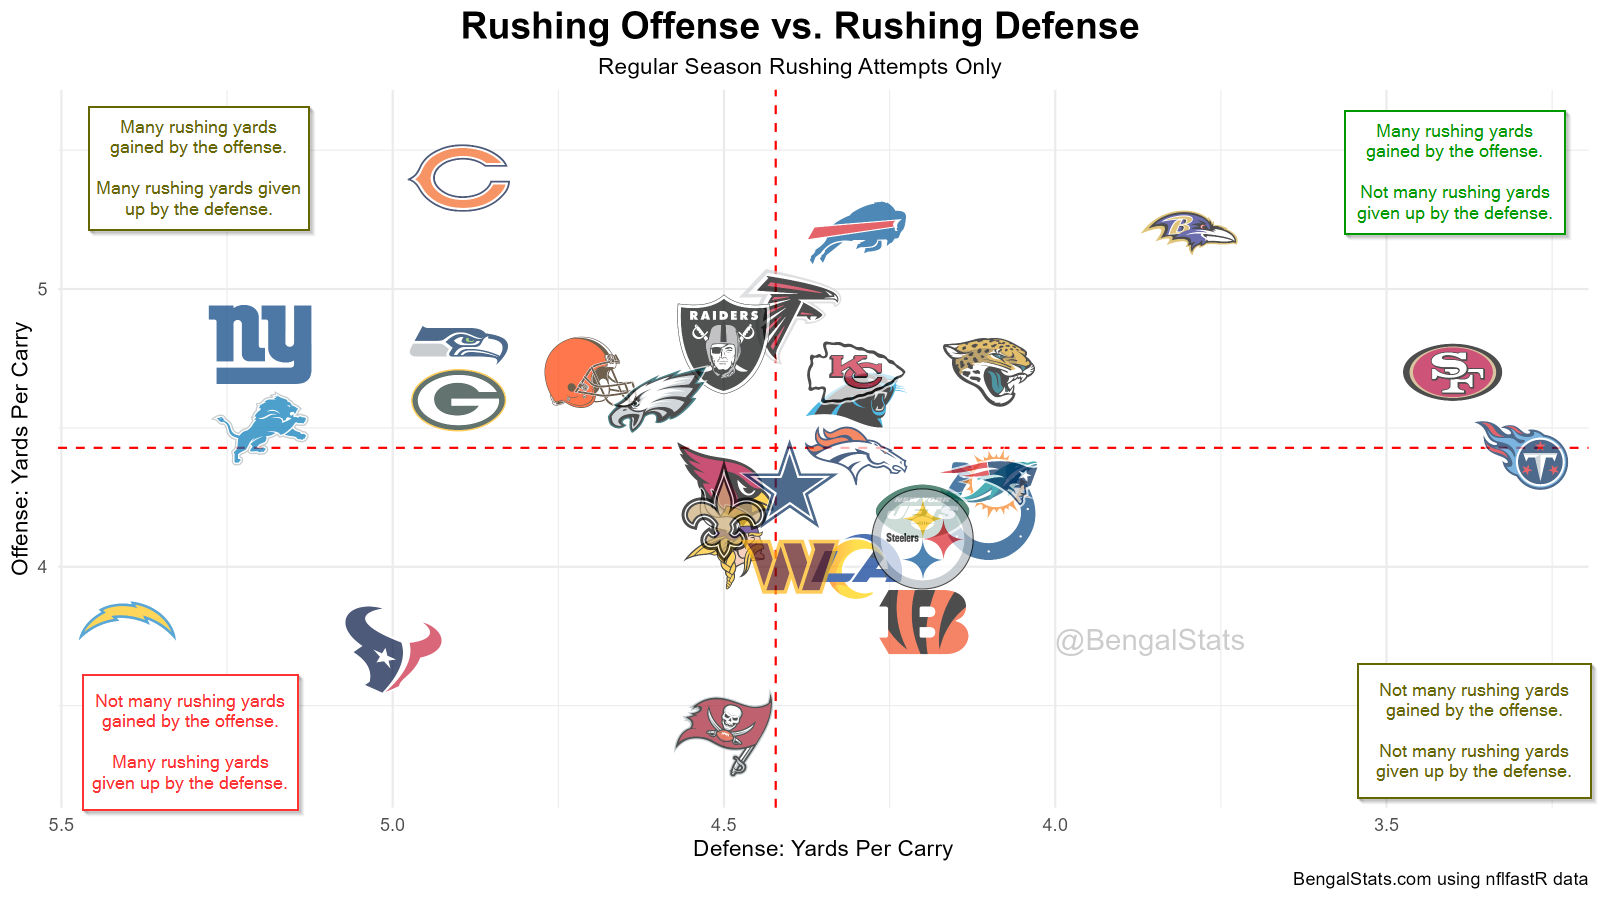
2022 Regular Season Rushing Offense vs. Rushing Defense
For this analysis, I pulled 2022 play-by-play data, filtered it to include only regular season rushing plays, then broke it up into two groups: offense and defense. Using this data I found the Yards Per Carry for each team's offense and defense.
Next, I used ggplot2 to plot the two ratios against one another with average yards gained per rushing attempt as the vertical axis and average yards given up per rushing attempt by the defense on the x axis. Note that the x-axis is reversed, and the red-dashed lines are the mean values for that axis.
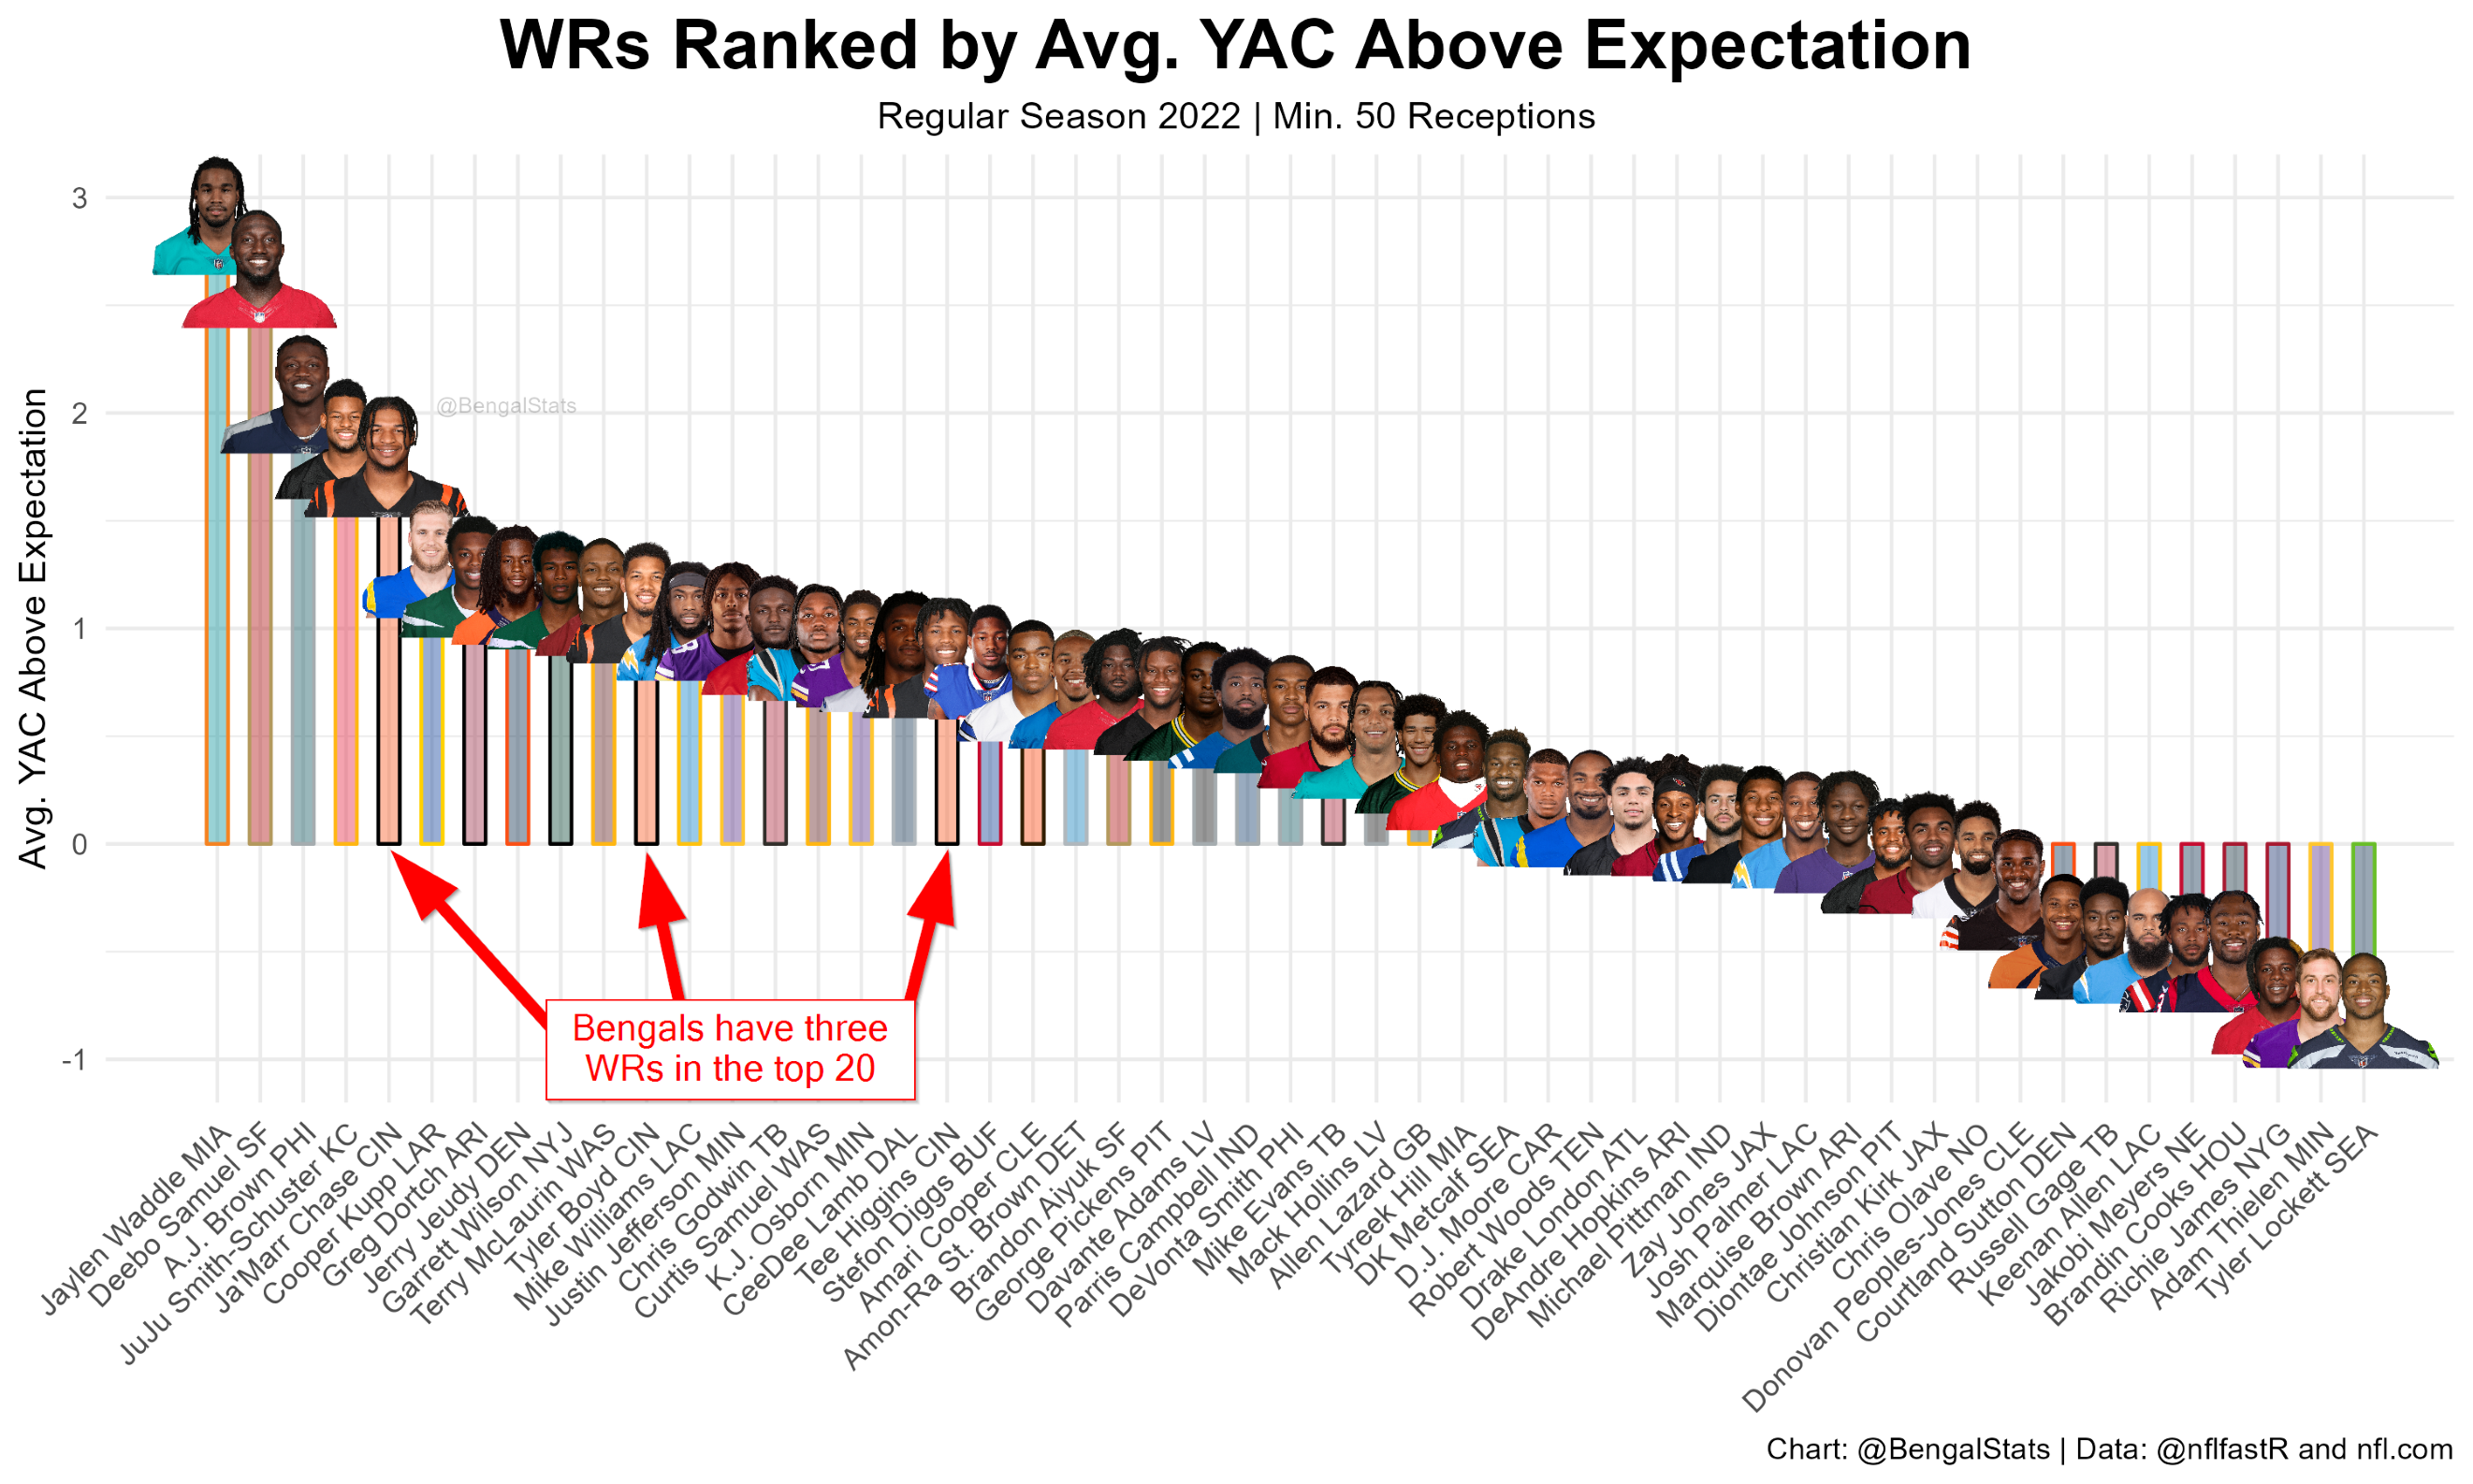
Top WRs of 2022 by Average YAC Above Expectation
Yards After Catch (YAC) is the total number of yards gained by a receiver after catching the ball. The NFL shares Expected Yards After Catch data, which they describe as "The expected yards after catch, based on numerous factors using tracking data such as how open the receiver is, how fast they’re traveling, how many defenders/blockers are in space, etc."
Average YAC Above Expectation, the focus of this bar chart, tells you how many yards each receiver gained (on average) after the catch - above what is predicted by the NFL's models.
The Bengals have three WRs in the top 20 qualifying WRs. During Free Agency the Bengals upgraded the left tackle position by signing Orlando Brown Jr. The draft is still on the horizon and there are more changes to come, so it's too early to say with any confidence what to expect for next year, but if the Bengals continue to build the offensive line they may be ready to make another run.
QBs Ranked by Third Down Conversion Rate
This bar chart ranks QBs in descending order by their third down passing play conversion rate. The data includes only regular season, third down passing plays and excludes QB kneels and timeouts. Note that scrambles and sacks are included. Very exciting to see our boy ranked in the top three, and now with Orlando Brown protecting Burrow’s blind side we’re well positioned heading into the draft.
.png)
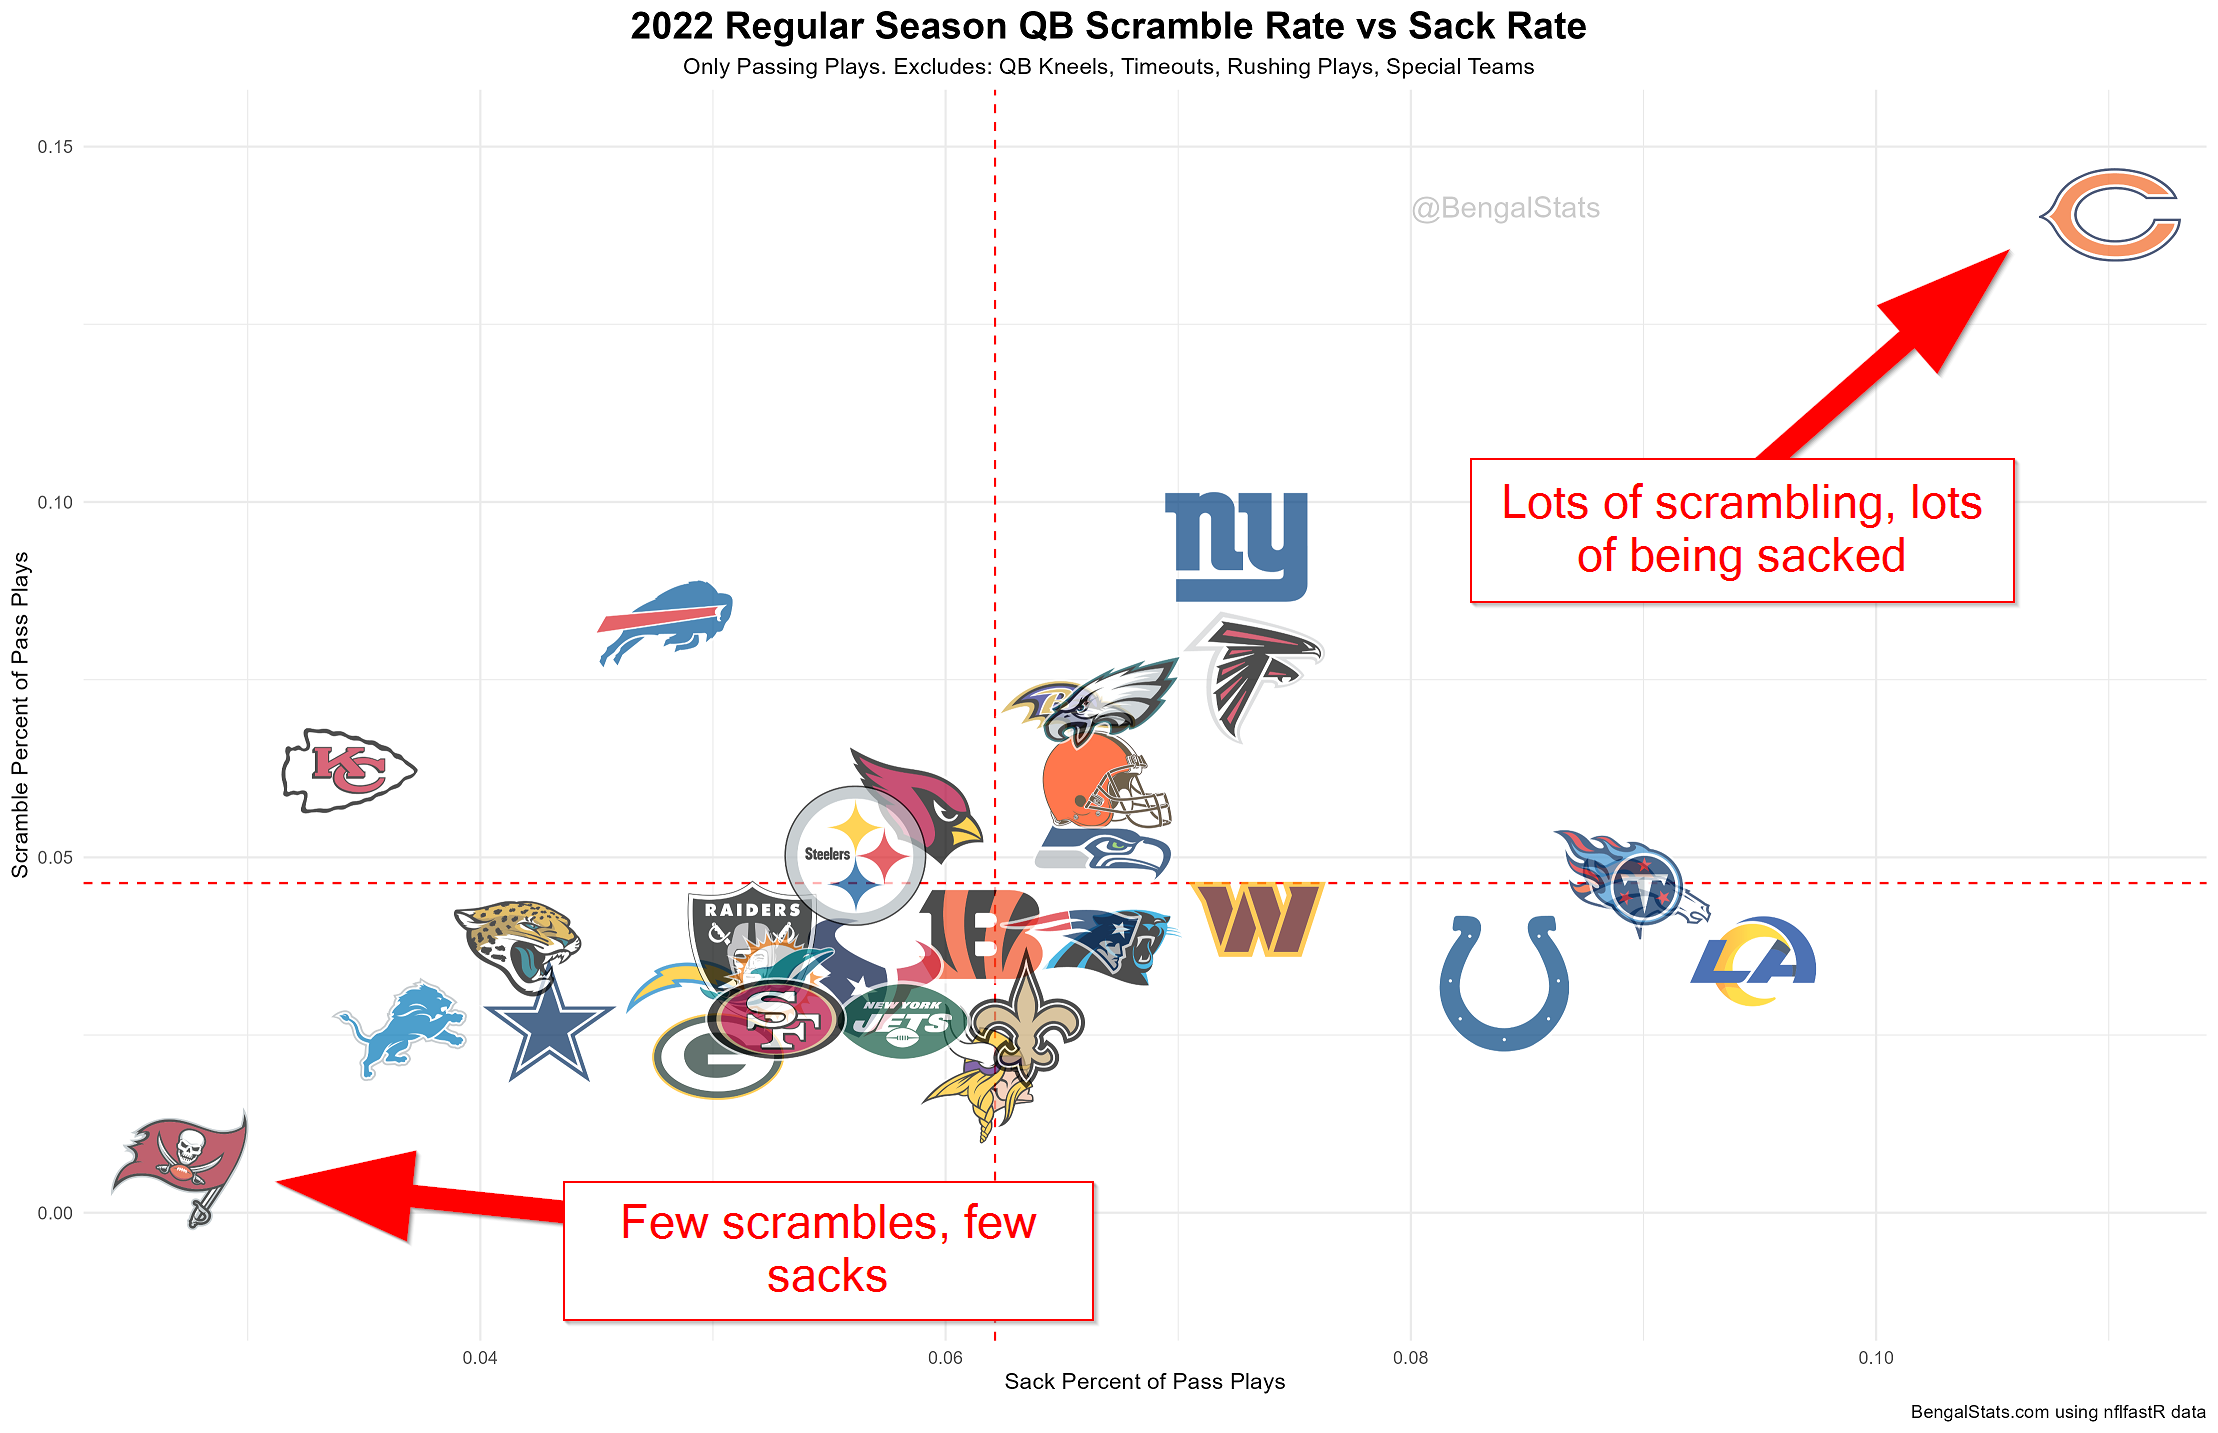
2022 Regular Season QB Scramble Rate vs Sack Rate
This scatter plot uses play-by-play data from the 2022 NFL regular season, and filters it to exclude: QB kneels, timeouts, rushing plays, and special teams plays.
The y-axis shows the Scramble Rate, which is calculated by dividing the number of plays where the QB scrambled by the total number of passing plays that meet the criteria described above.
The x-axis does the same for sacks: total sacks divided by the total number of passing plays.
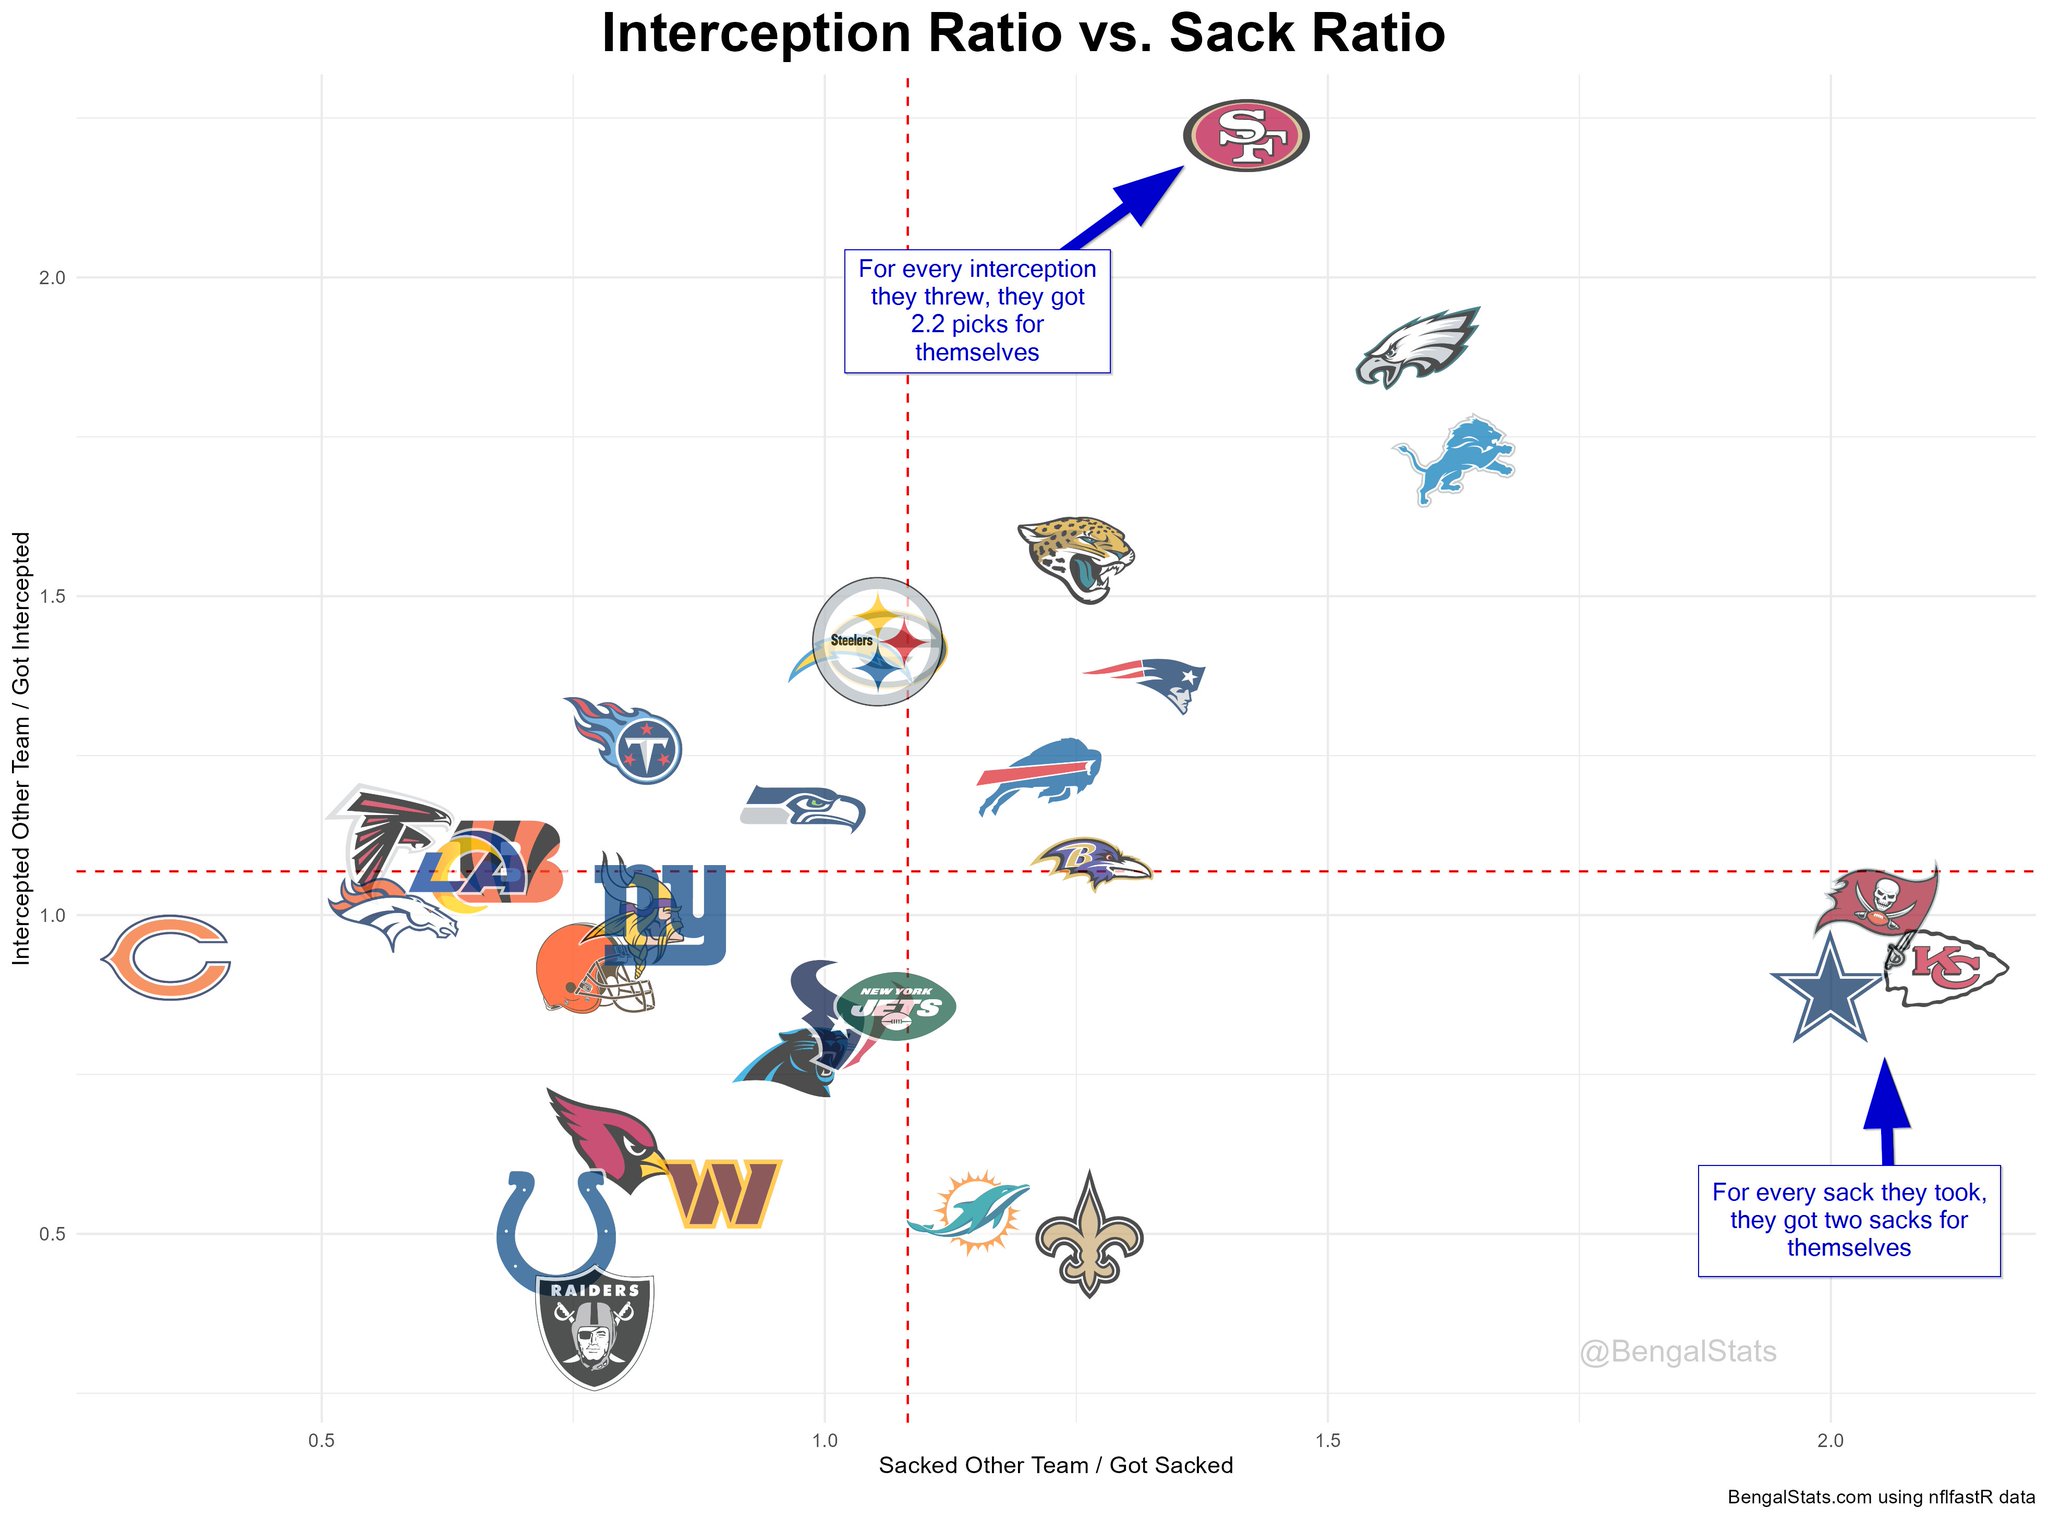
2022 NFL Regular Season Interceptions vs. Sacks
This scatter plot calculates two ratios for each team: interception ratio and sack ratio.
The interception ratio is calculated by dividing the number of times a given team picked off the opposing QB by the number of picks thrown by their own QB - a value over one means you intercepted more than you got intercepted.
The sack ratio is calculated by dividing the number of times each team sacked the opposing QB by the number of times the team's own QB was sacked - a value over one means that you sacked more than you got sacked.
2022 NFL Regular Season First Downs from Penalties
The recent TDs vs. First Downs analysis brought up some interest in looking at the number of first downs from penalites. Pretty surprised to see the Bengals ranked second overall.
.png)
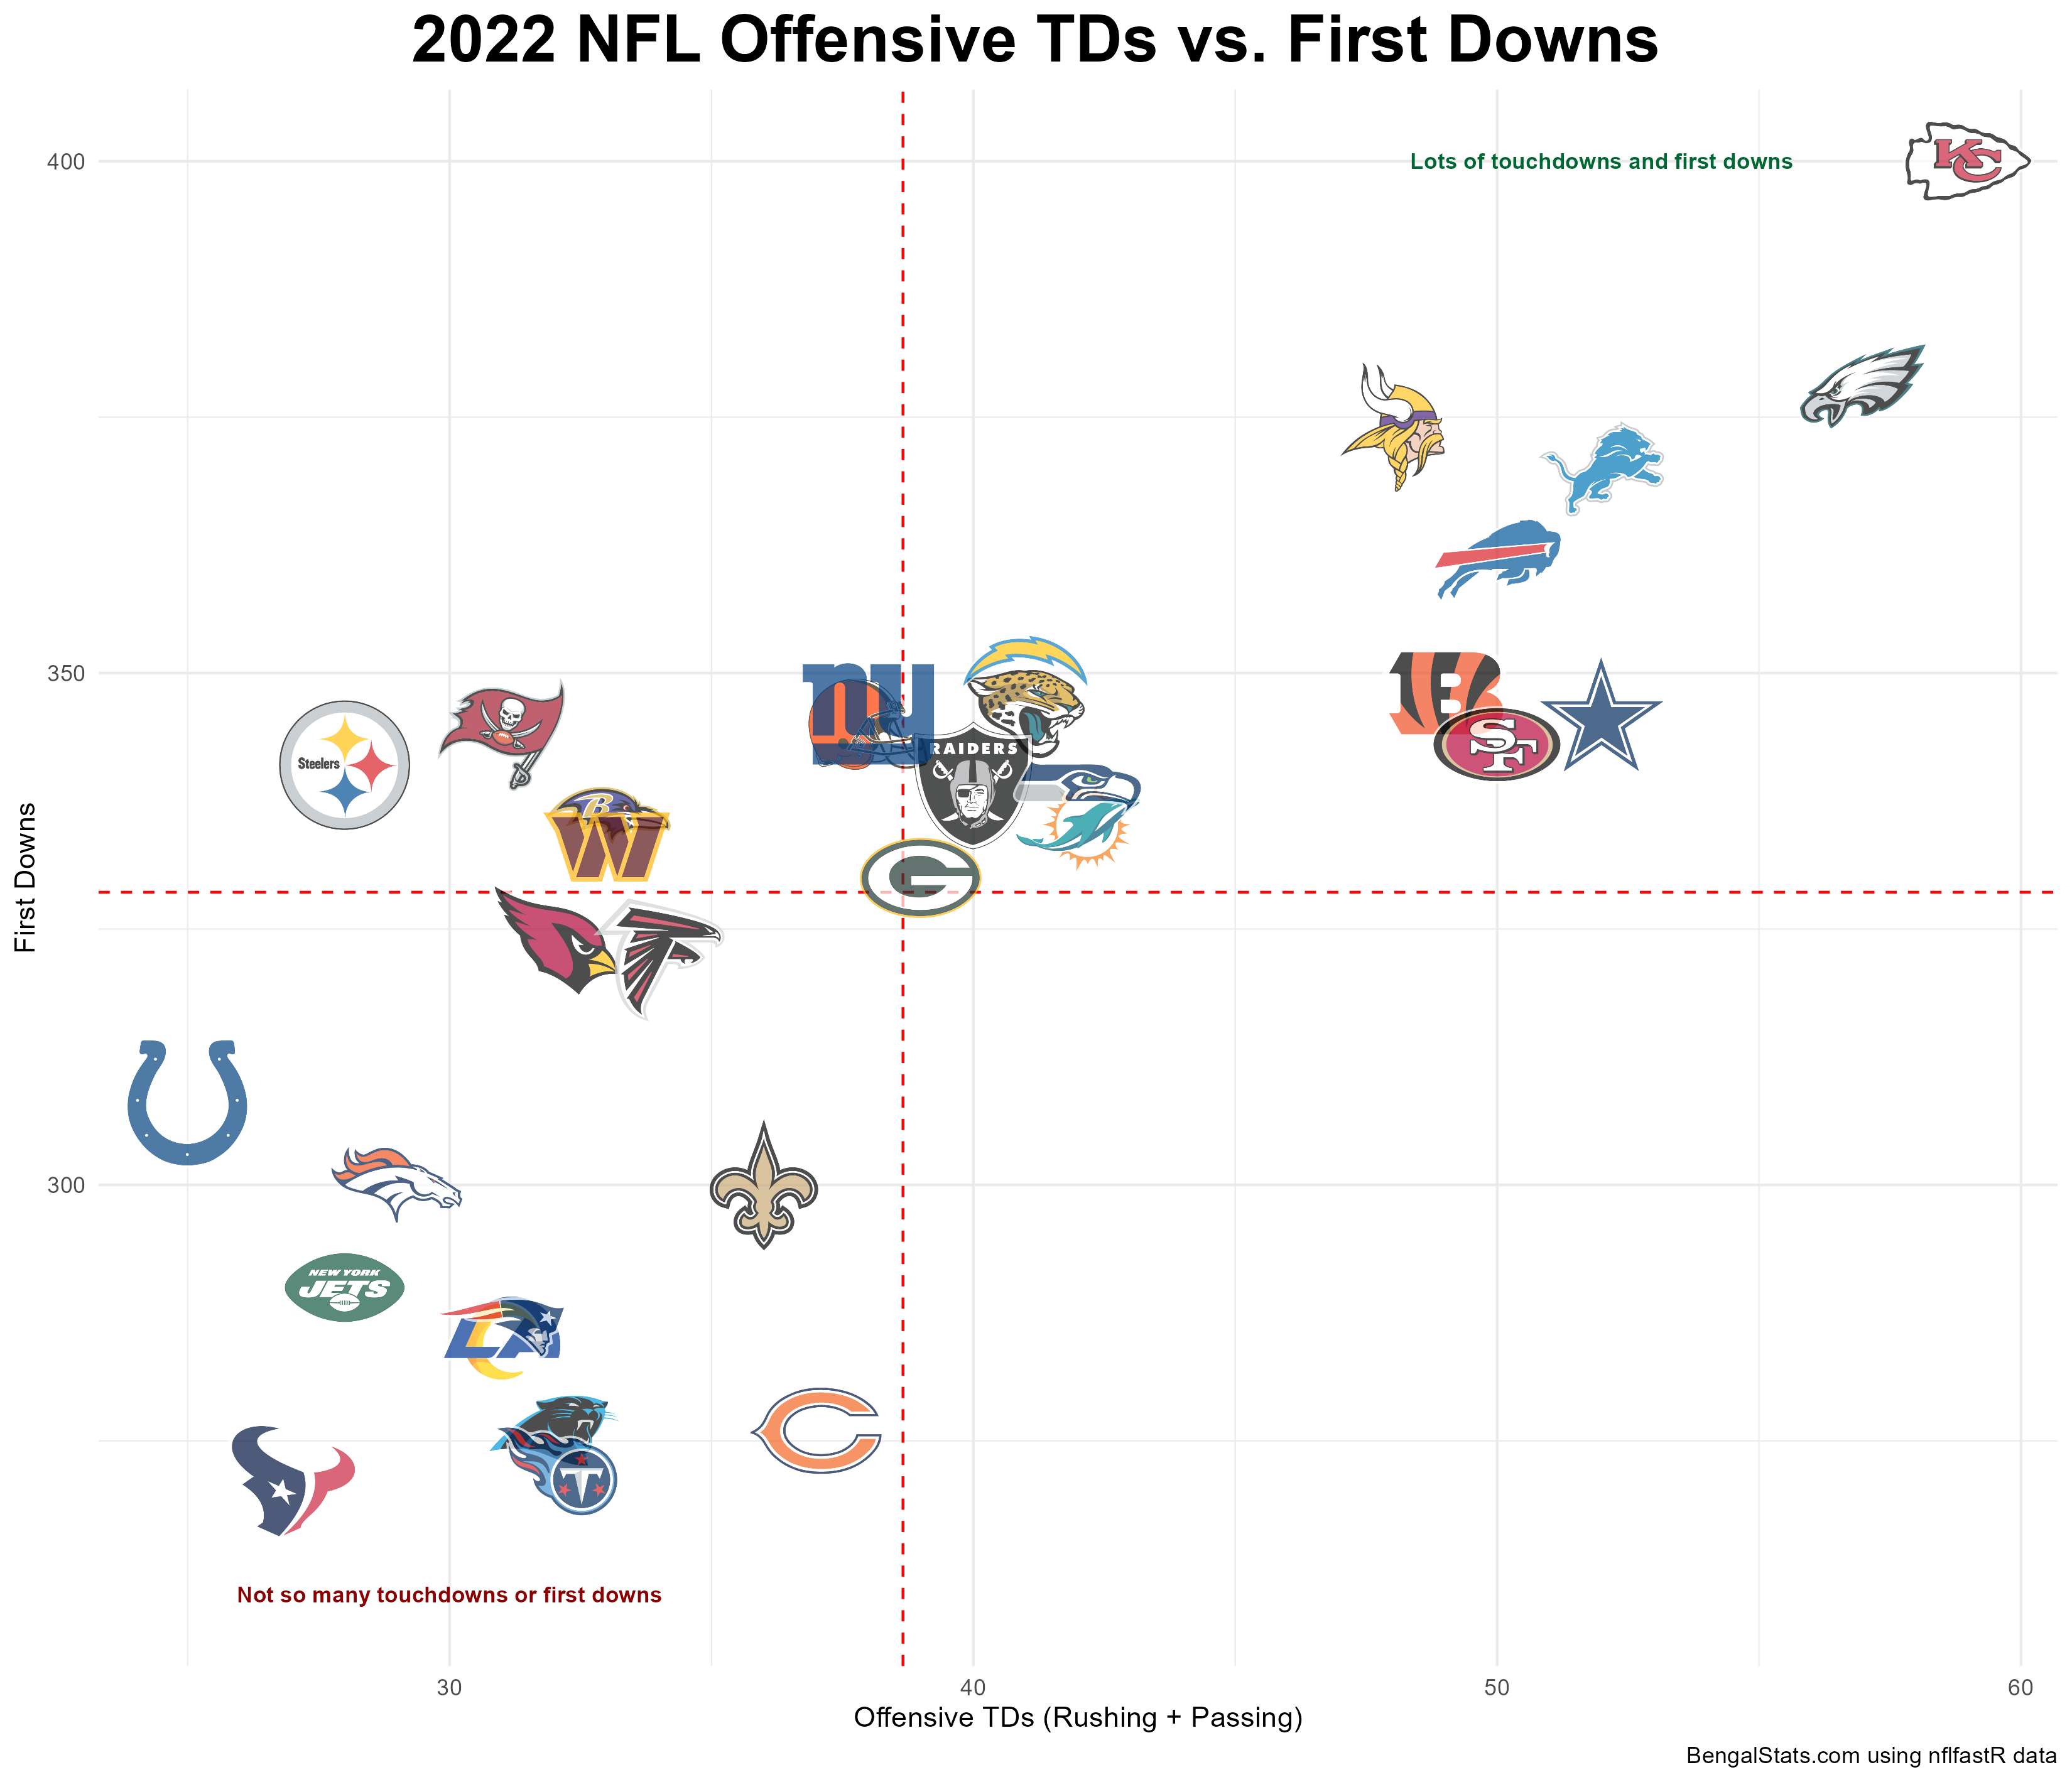
2022 NFL Regular Season Offensive TDs vs First Downs
This visual compares each team in terms of total offensive touchdowns vs total first downs. The clear correlation cleanly divides the league into two primary categories. The data excludes first downs due to penalty as well as defensive or special teams TDs. Regular season only.
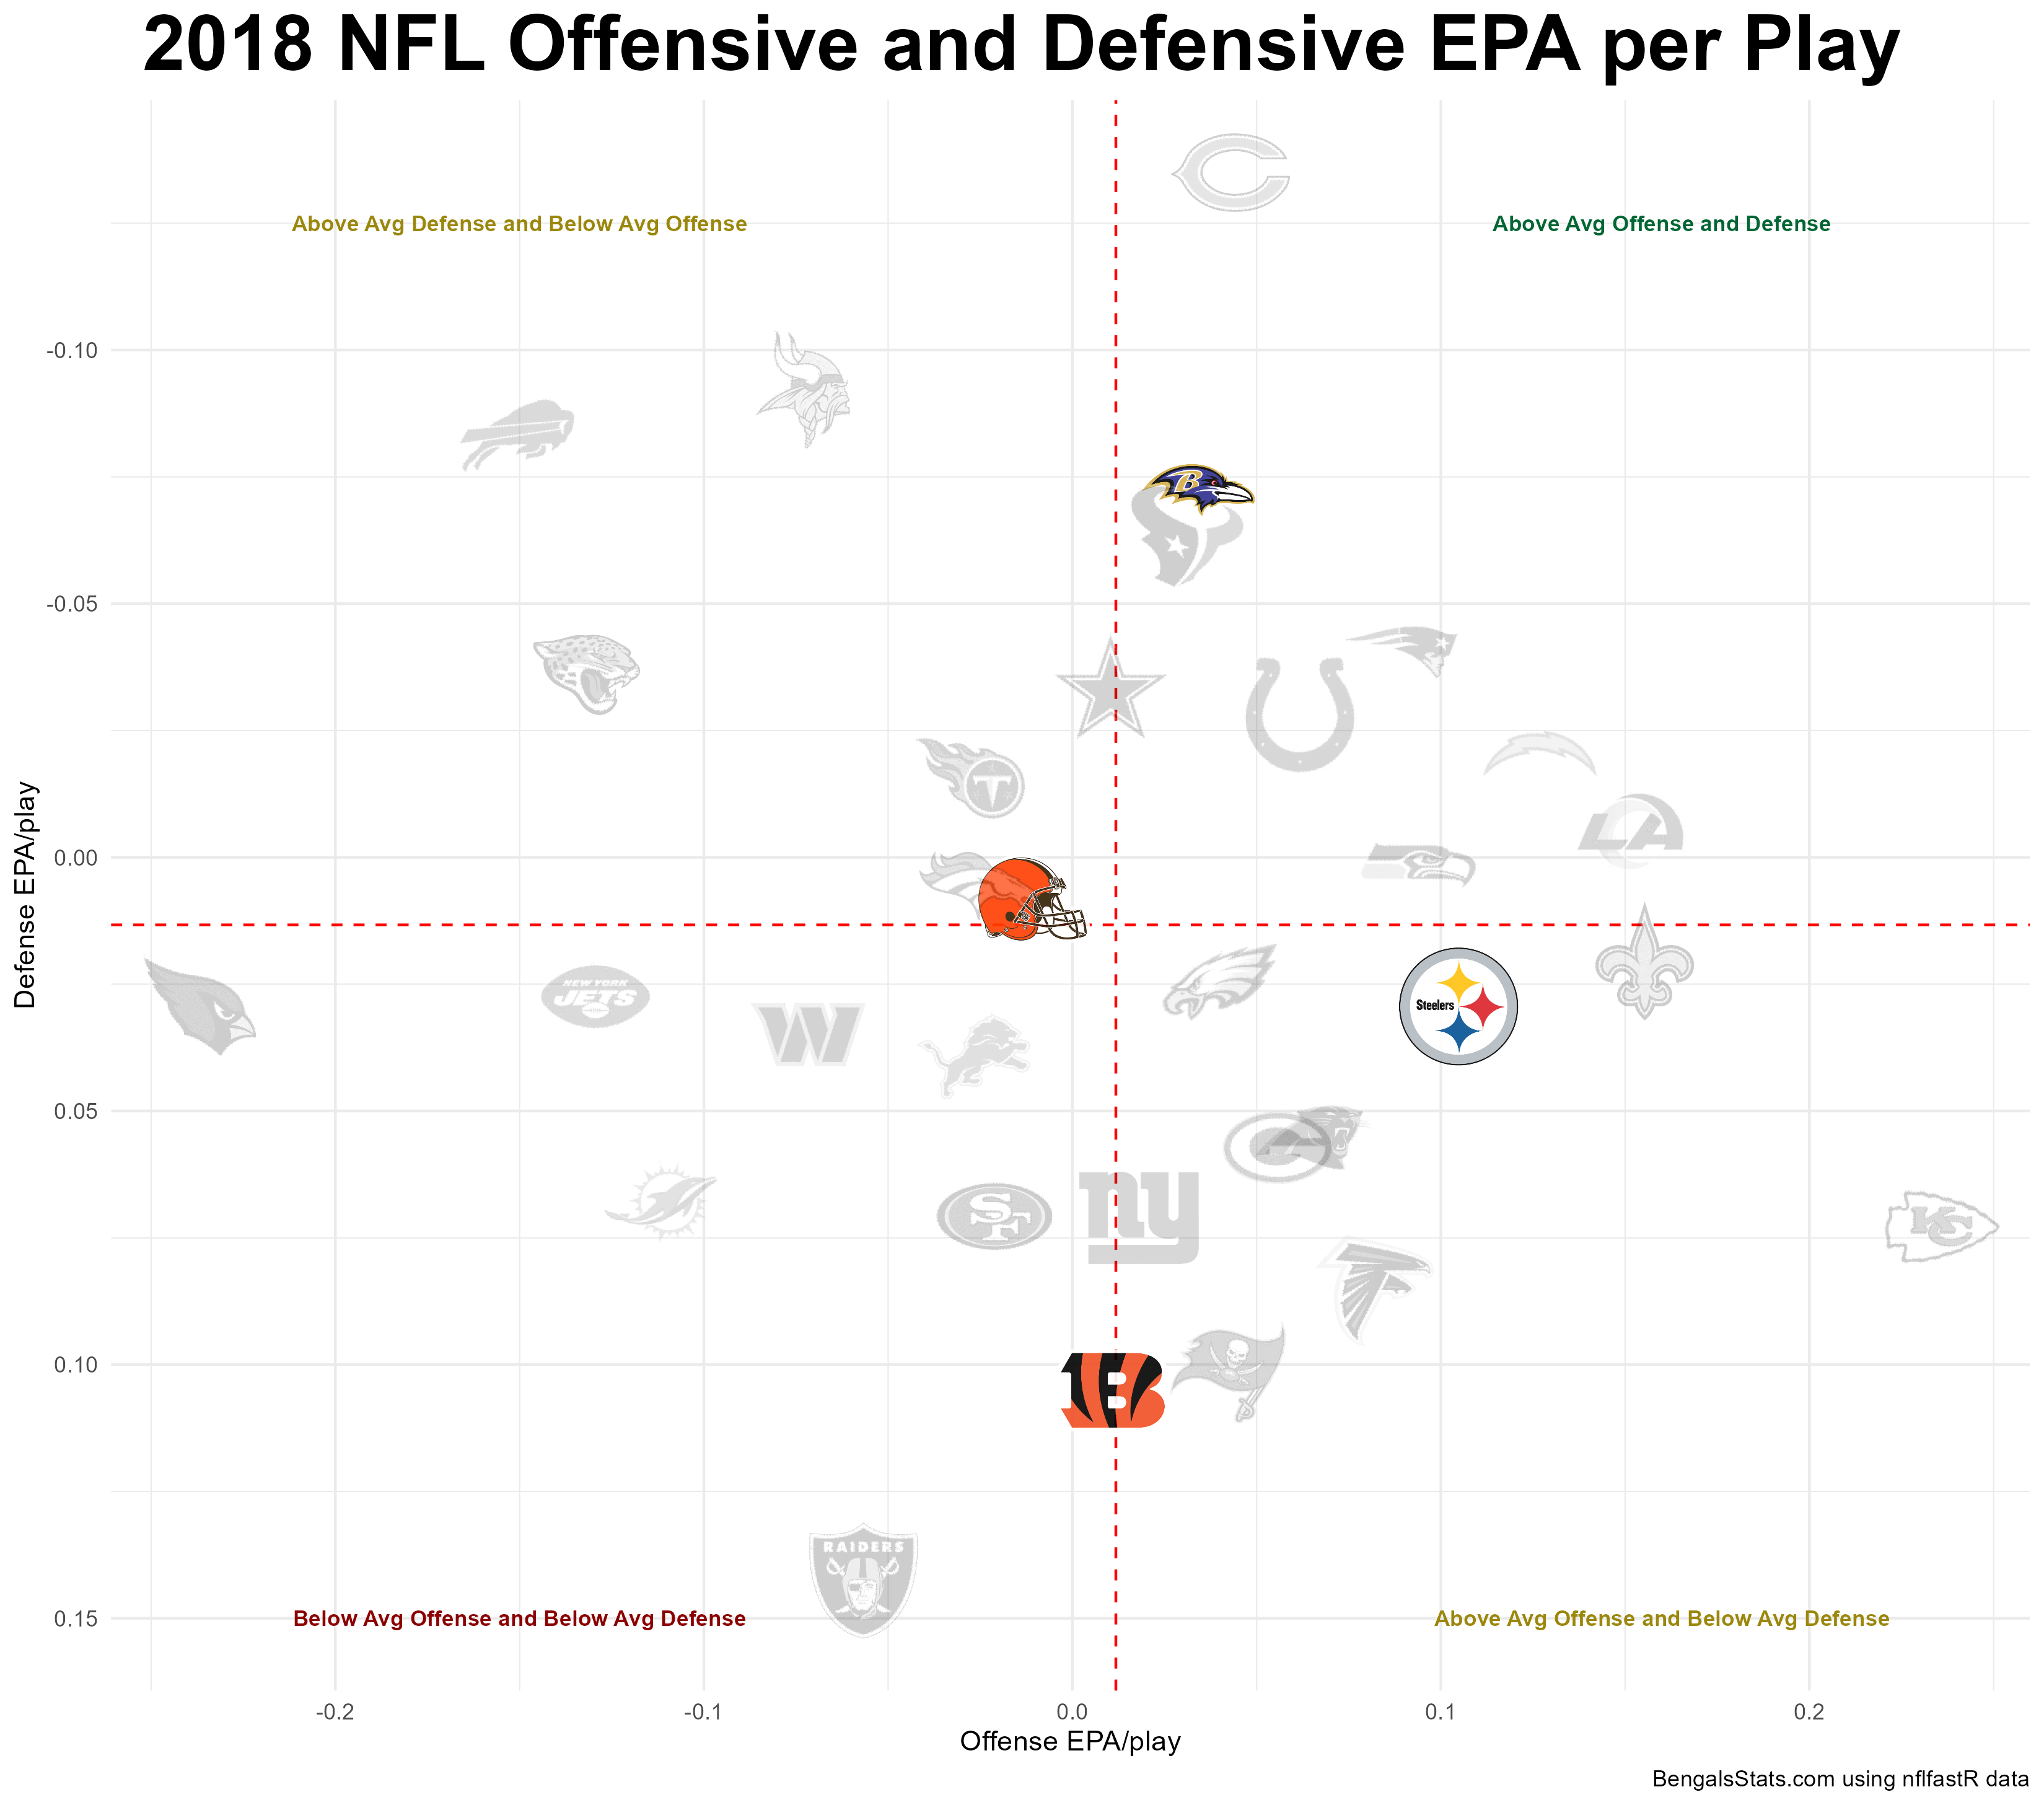
Bengals Regular Season Performance from Marvin's Final Year to 2023
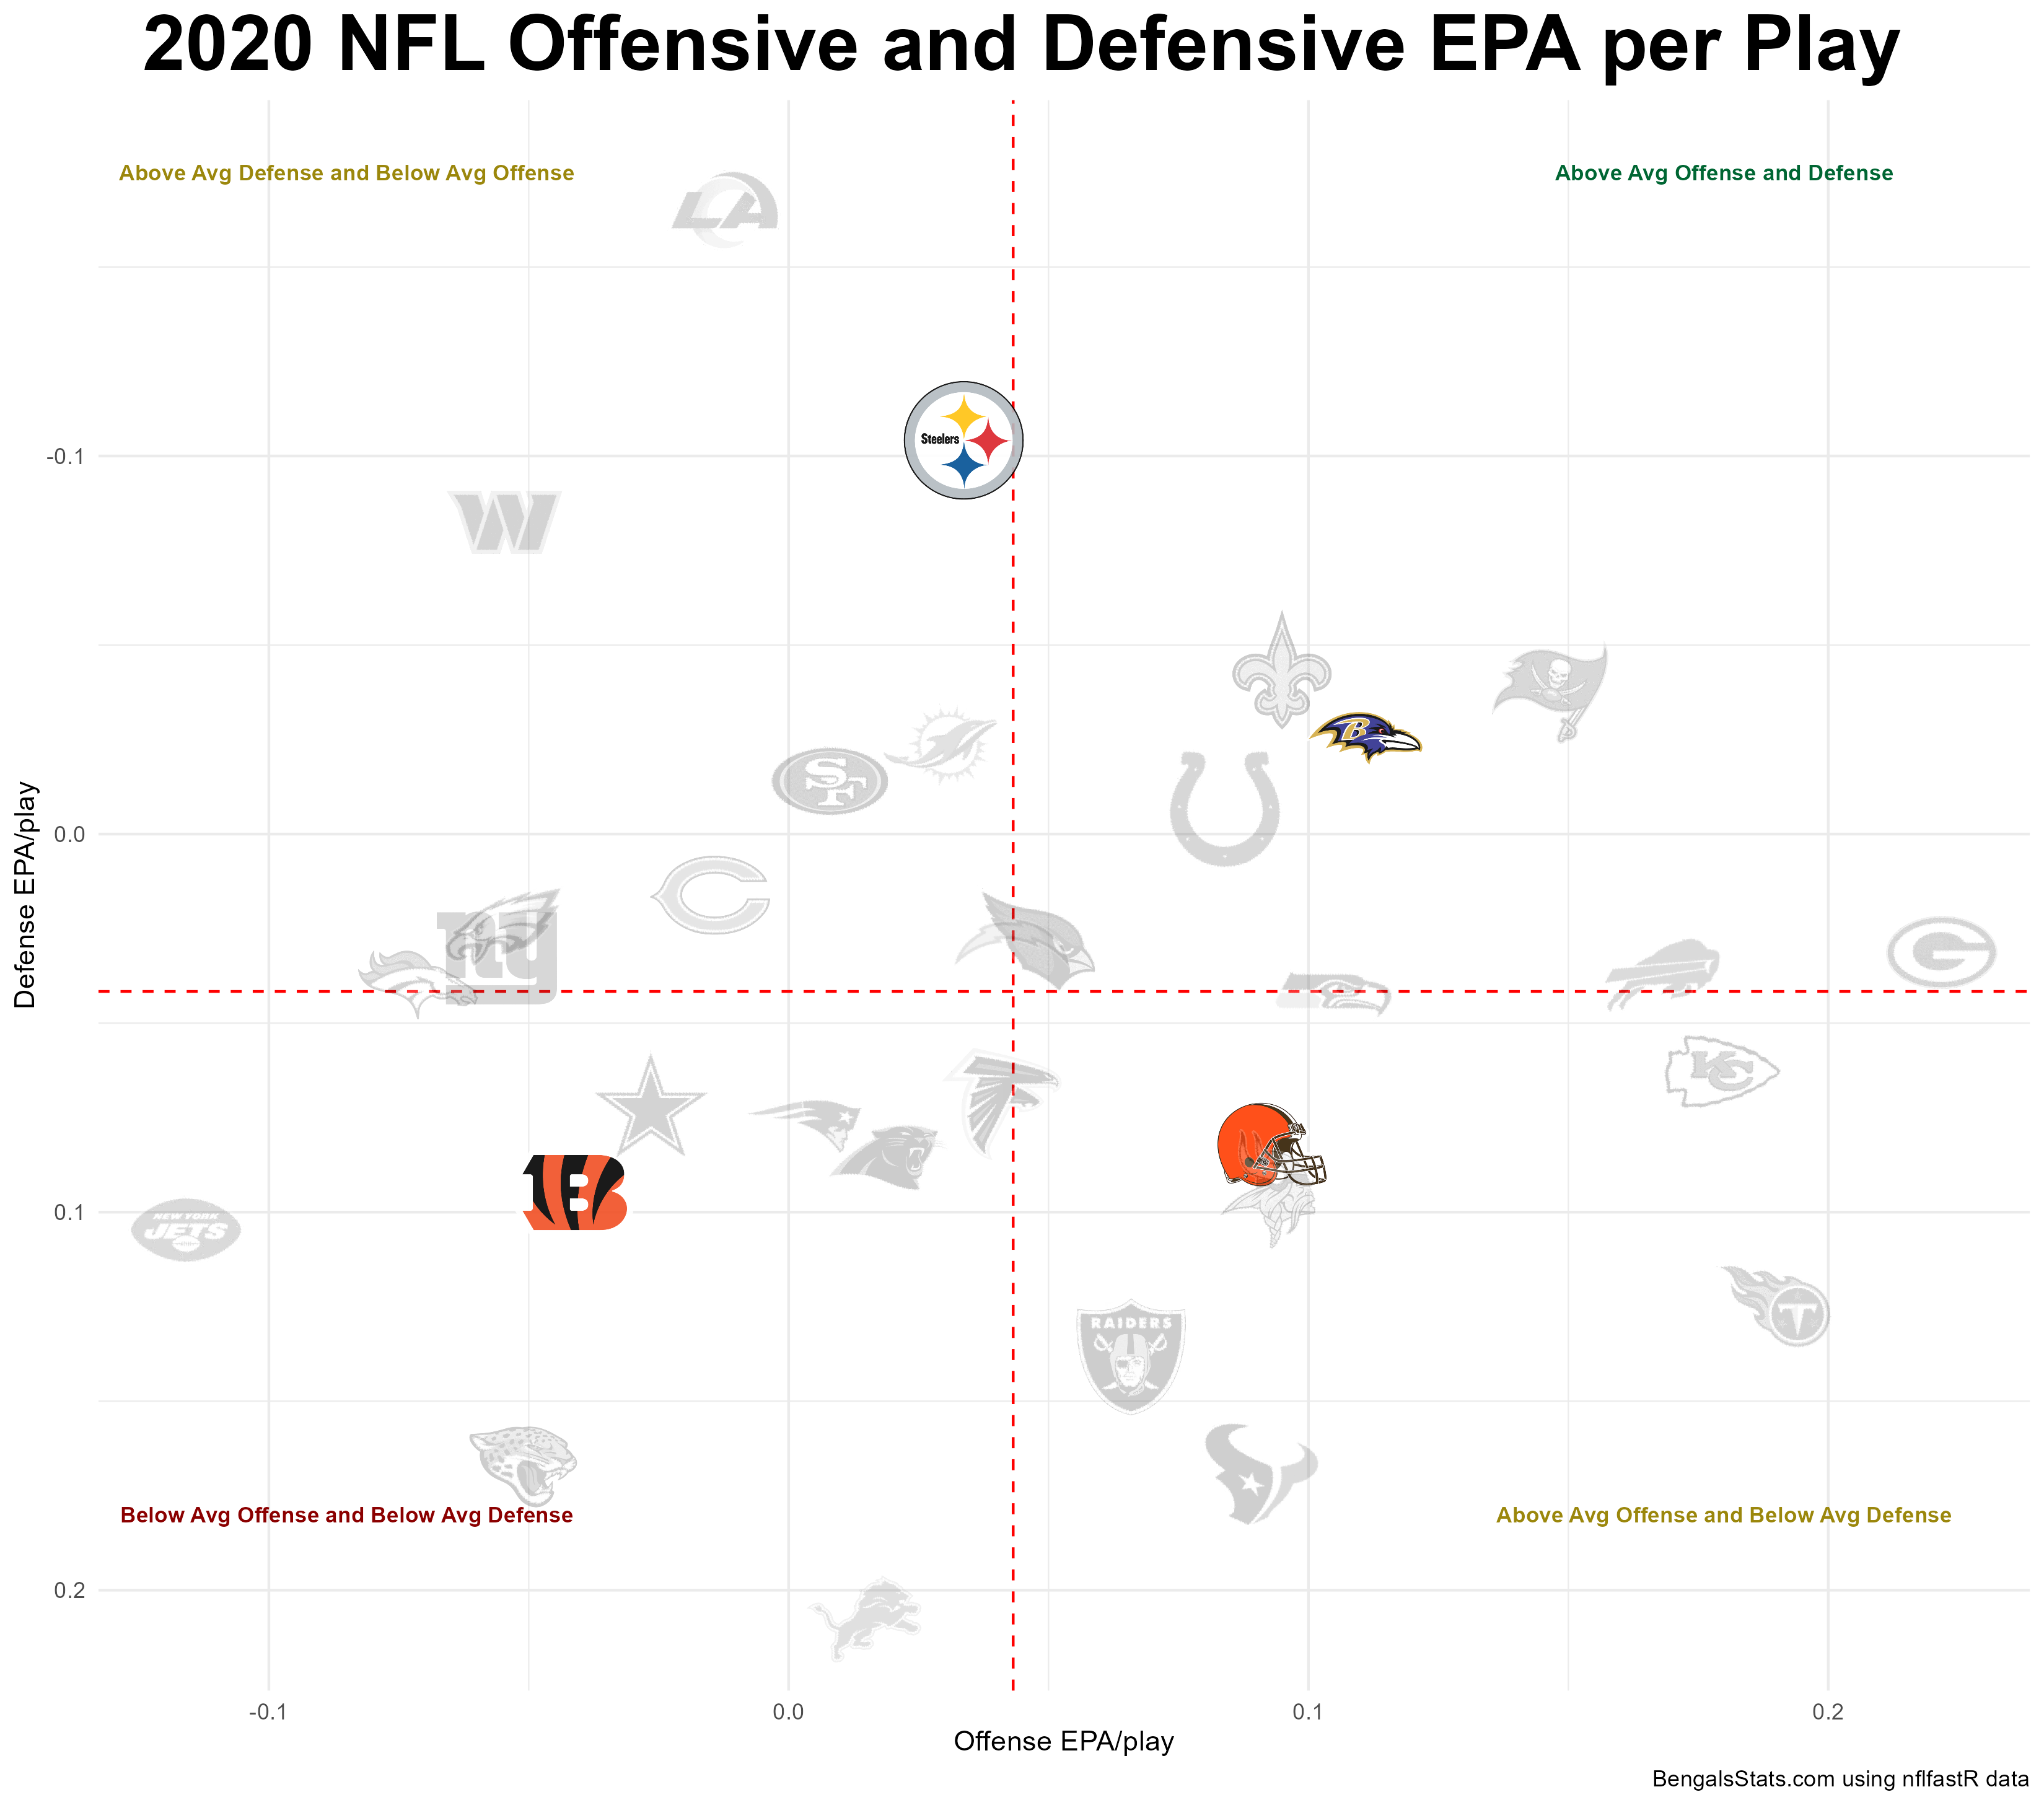
This is the first of five scatter plots that demonstrate how the Cincinnati Bengals have evolved from the final year of the Marvin Era to 2023. To do this I found the the mean EPA per play for both the offense and defense for each team, from play-by-play data provided by nflfastR for each season from 2018-2022. Note that this is regular season only. In 2018 the Bengals had one of the worst defenses in the league, with a perfectly average offense. This was the final season under Marvin Lewis.
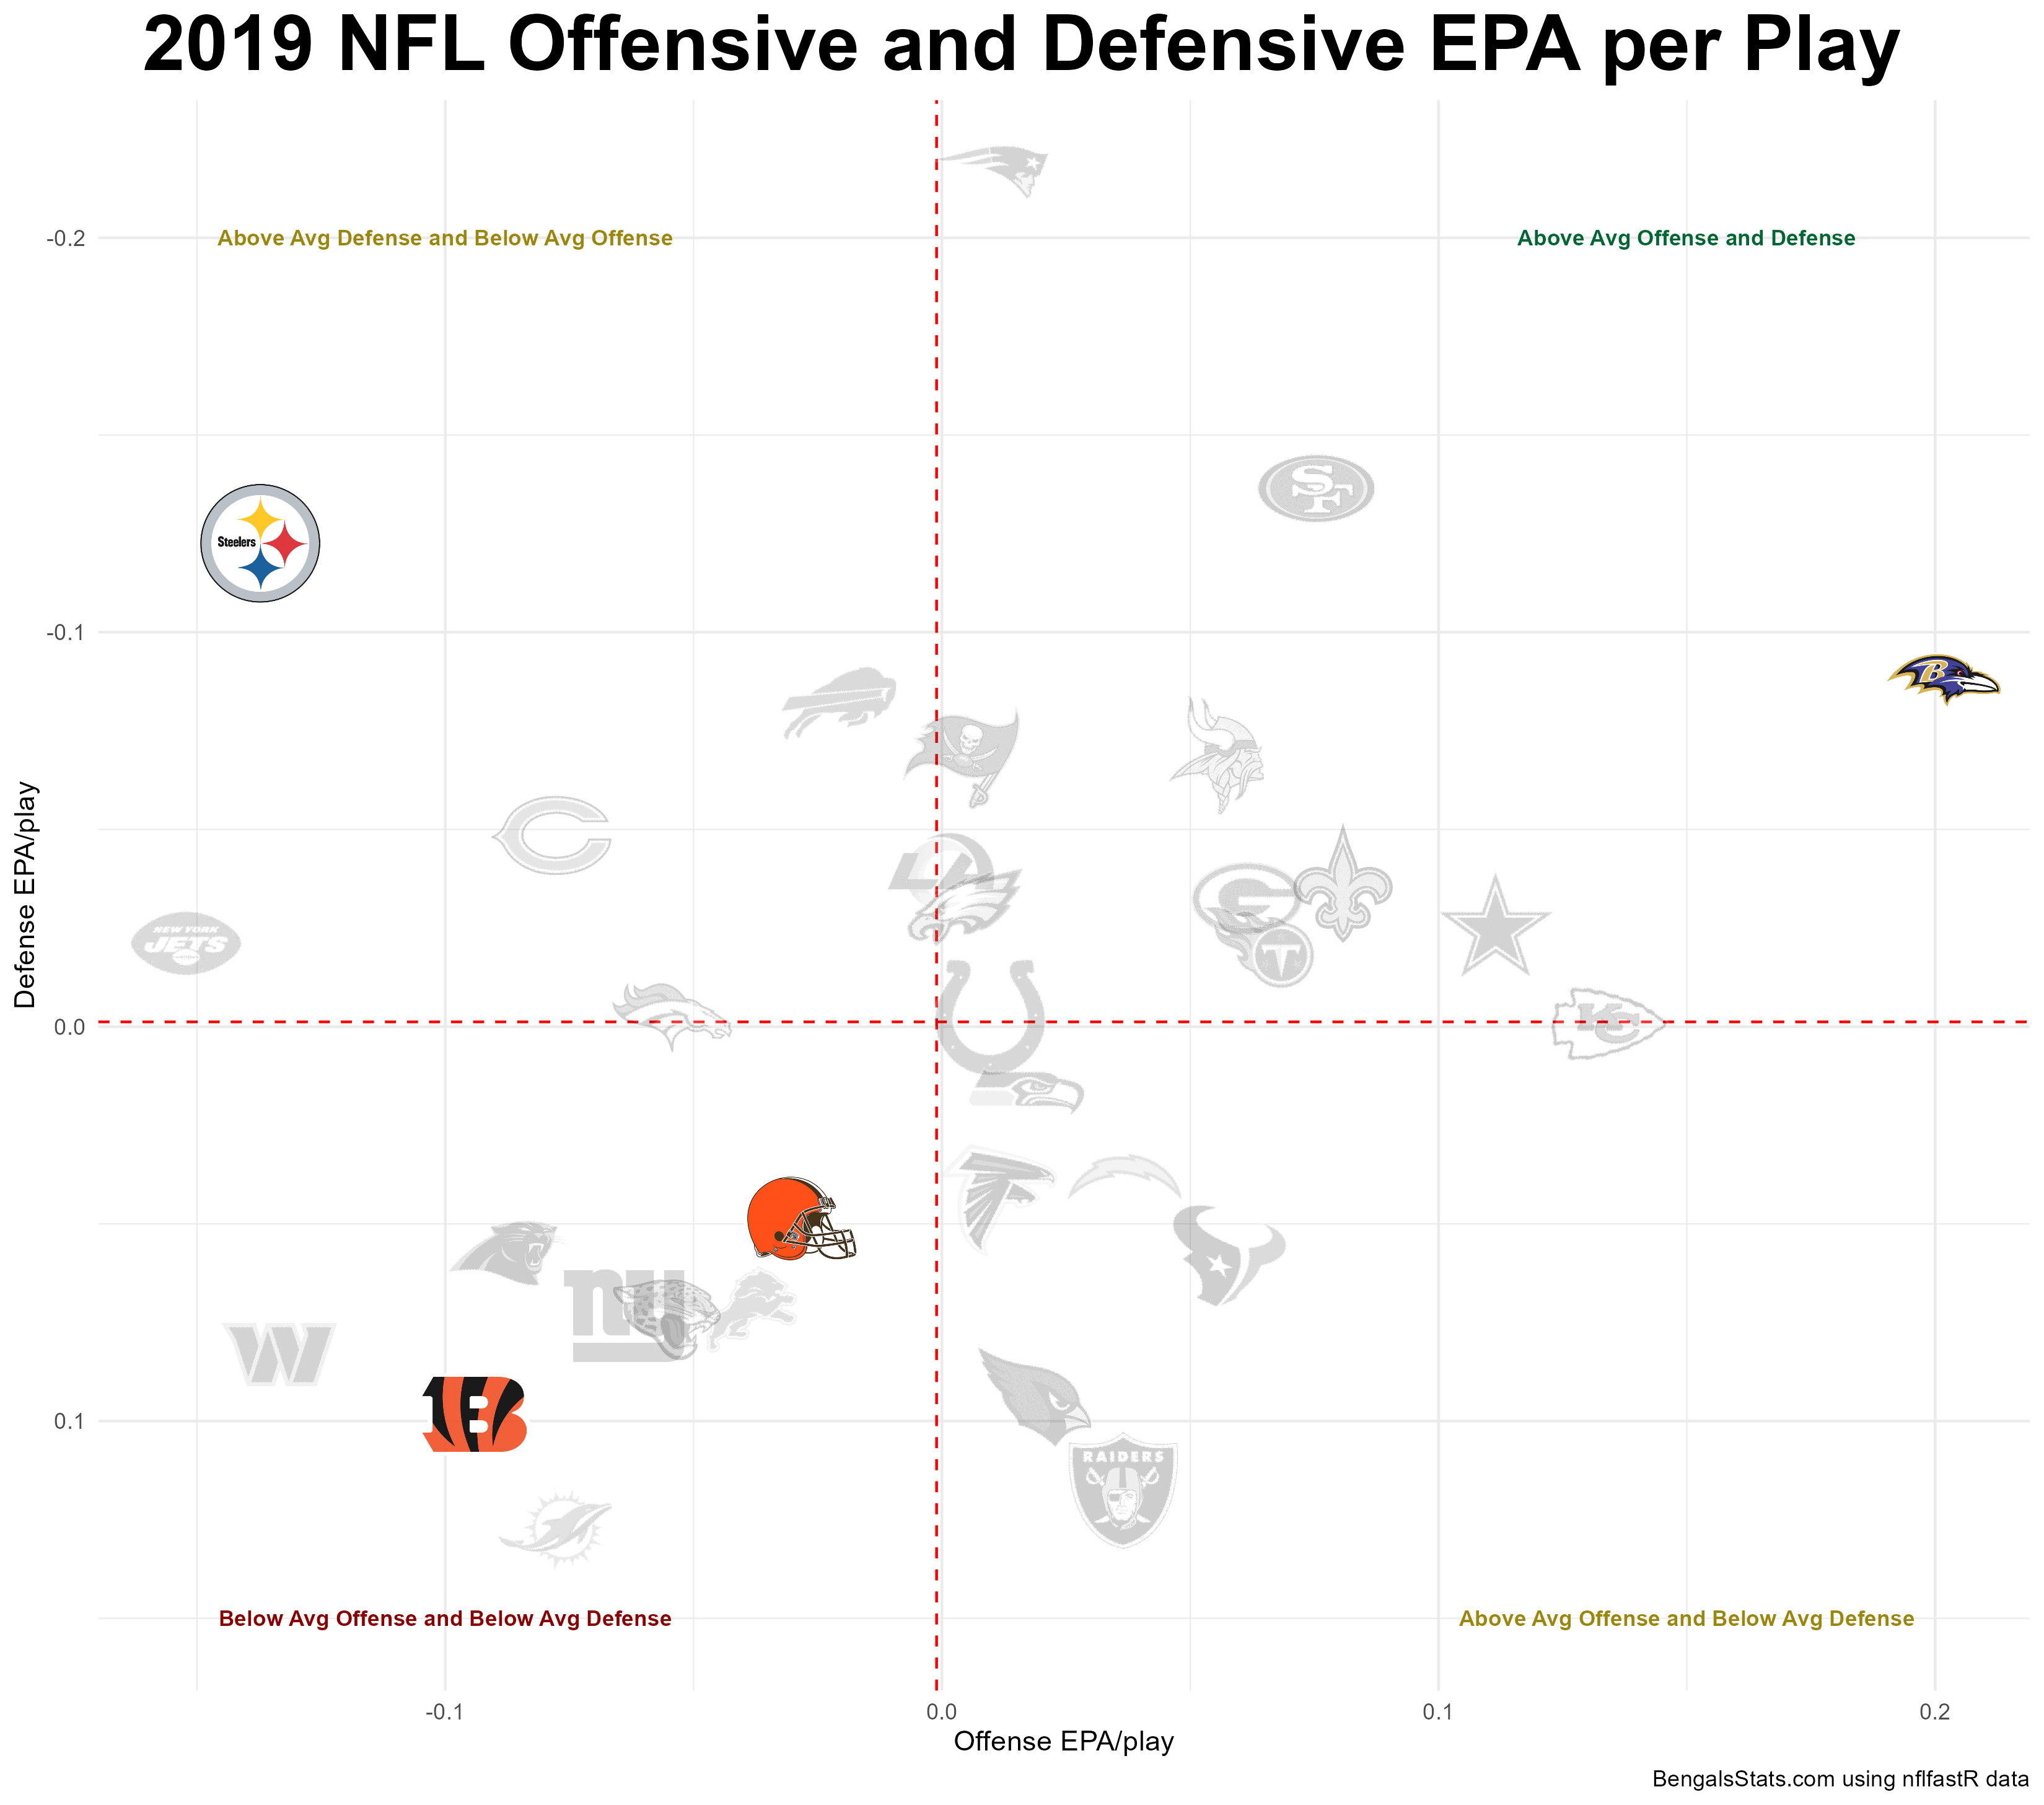
2019 saw a changing of the guard in Cincinnati as Zac Taylor's Bengals successfully secured the Joe Burrow Pick of the 2020 NFL Draft.
In 2020, tragic injury sidelined Burrow while the team finished in the below average category in both offense and defense, securing the Bengals a top-five pick and reuniting Burrow with Chase.
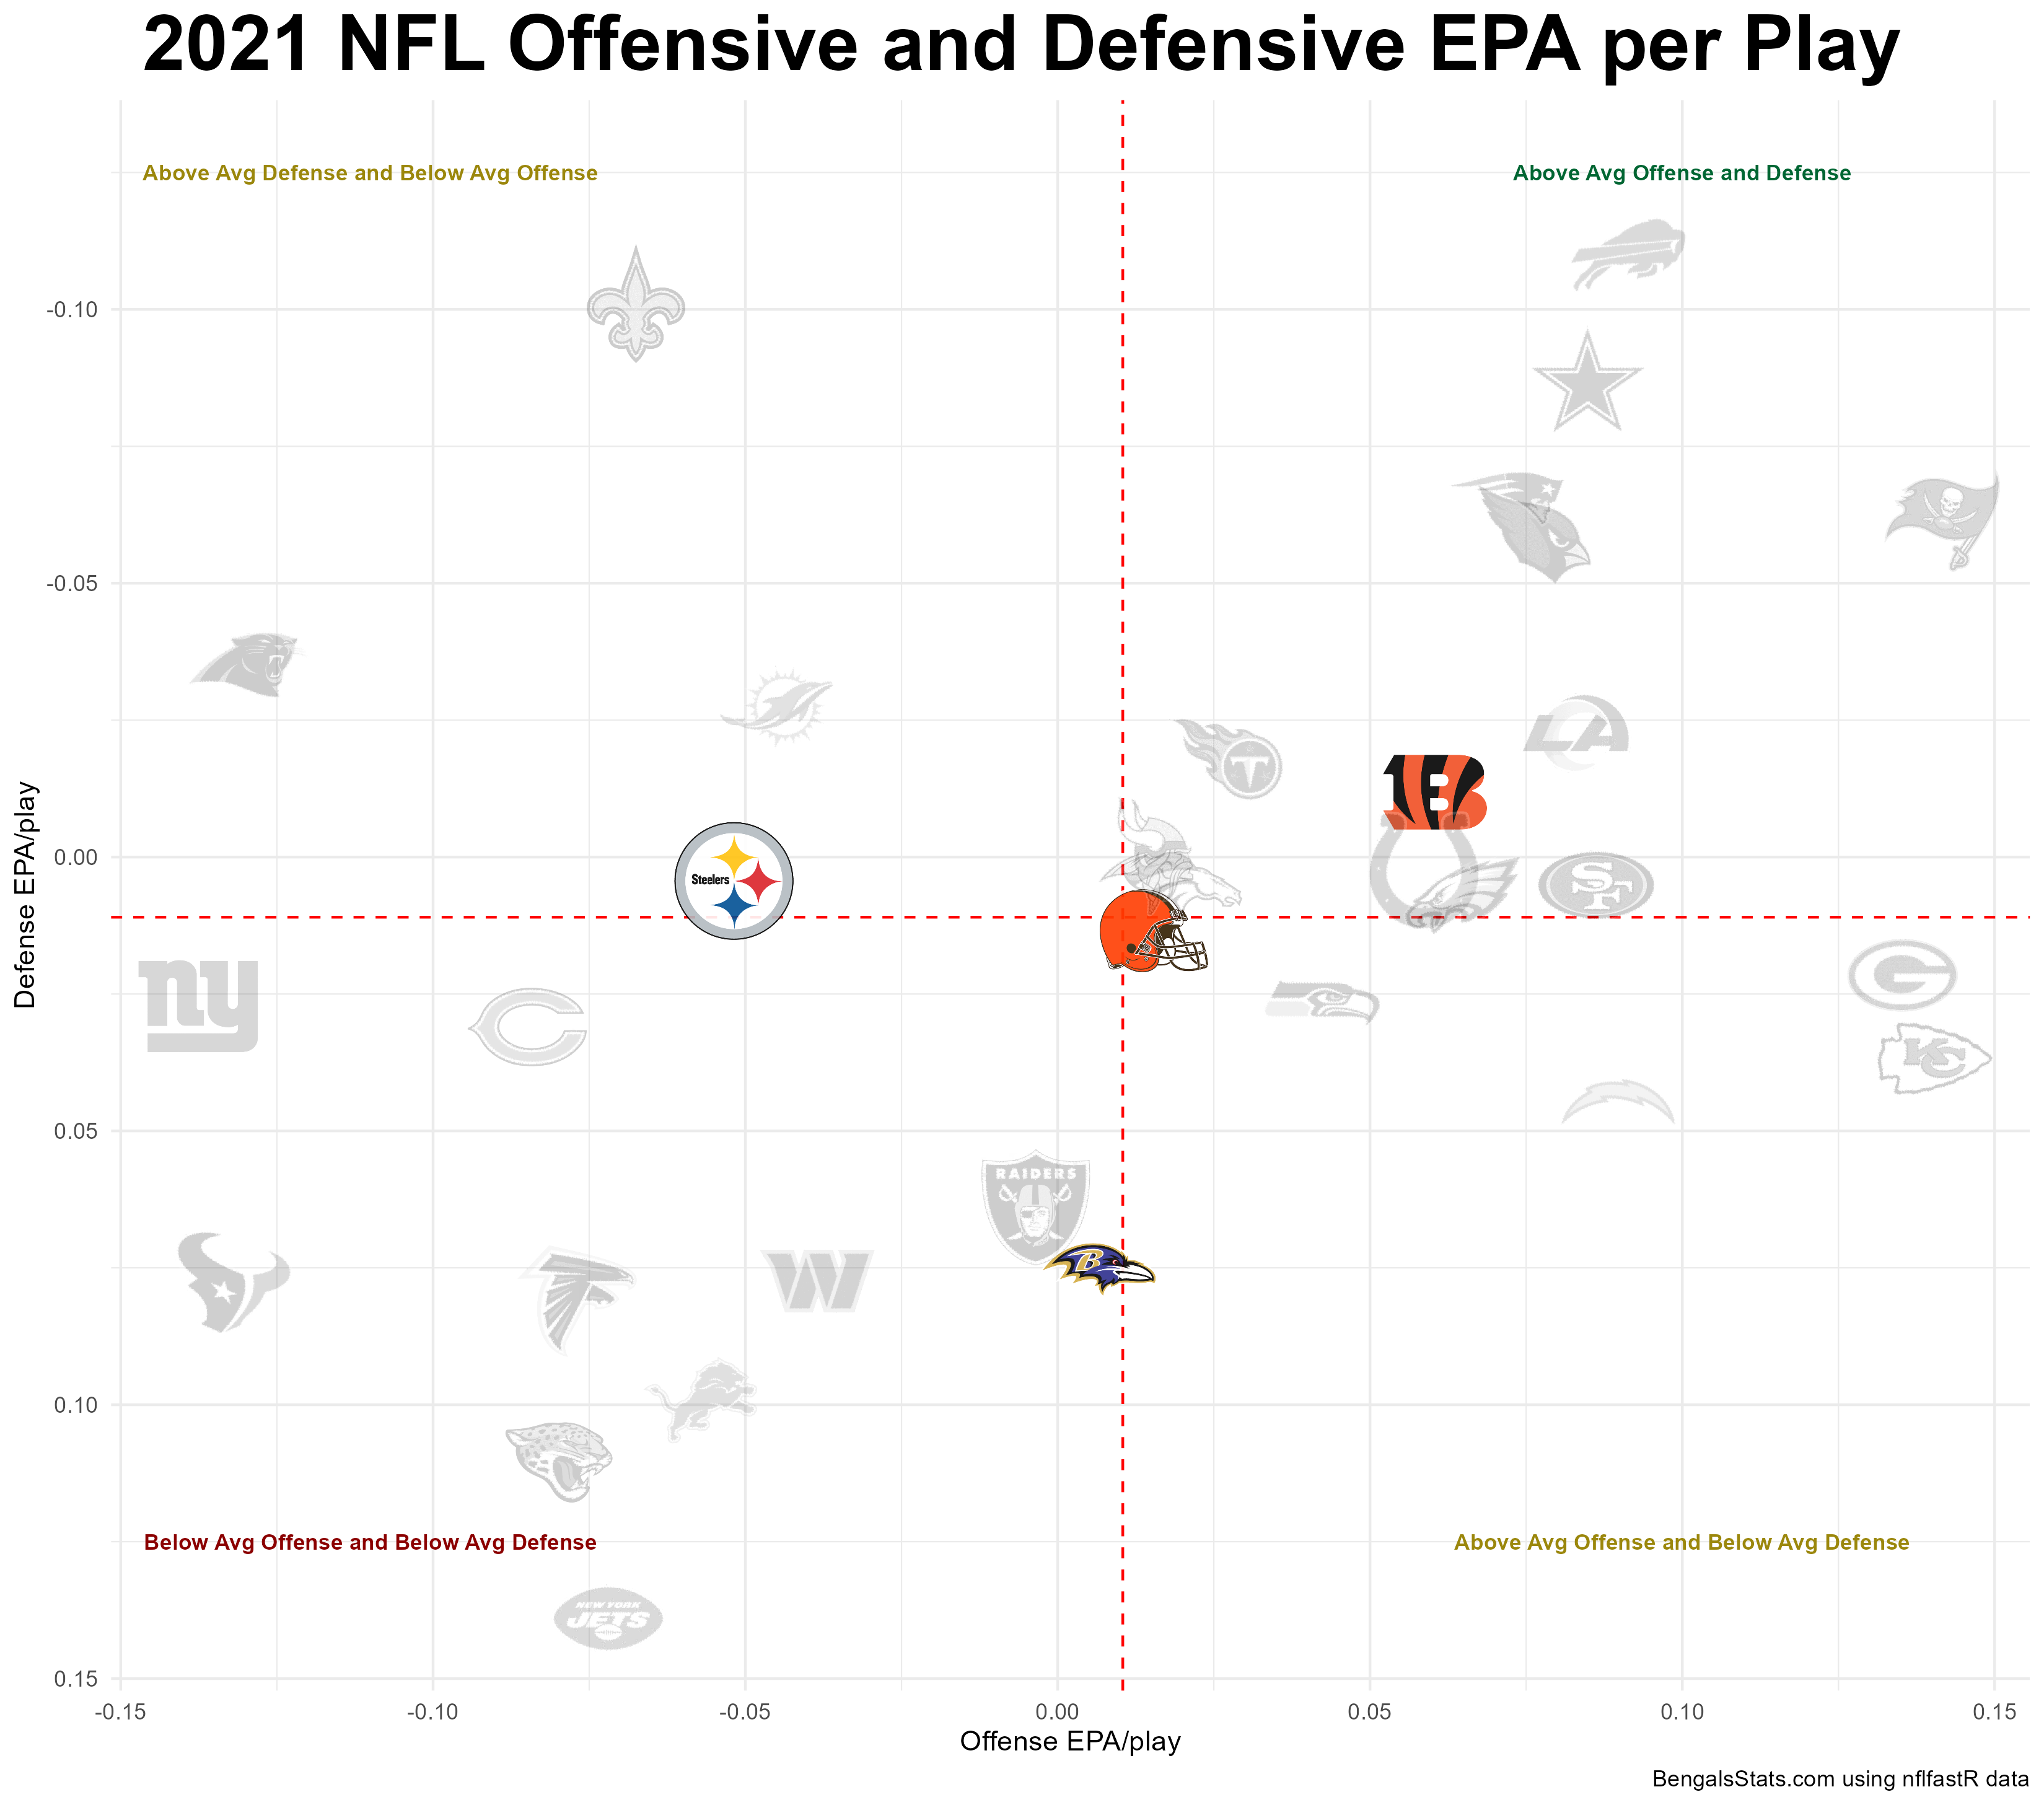
In 2021, things were starting to take off now with a healthy Burrow and an elite WR corps. Now in the above average category for offense and defense
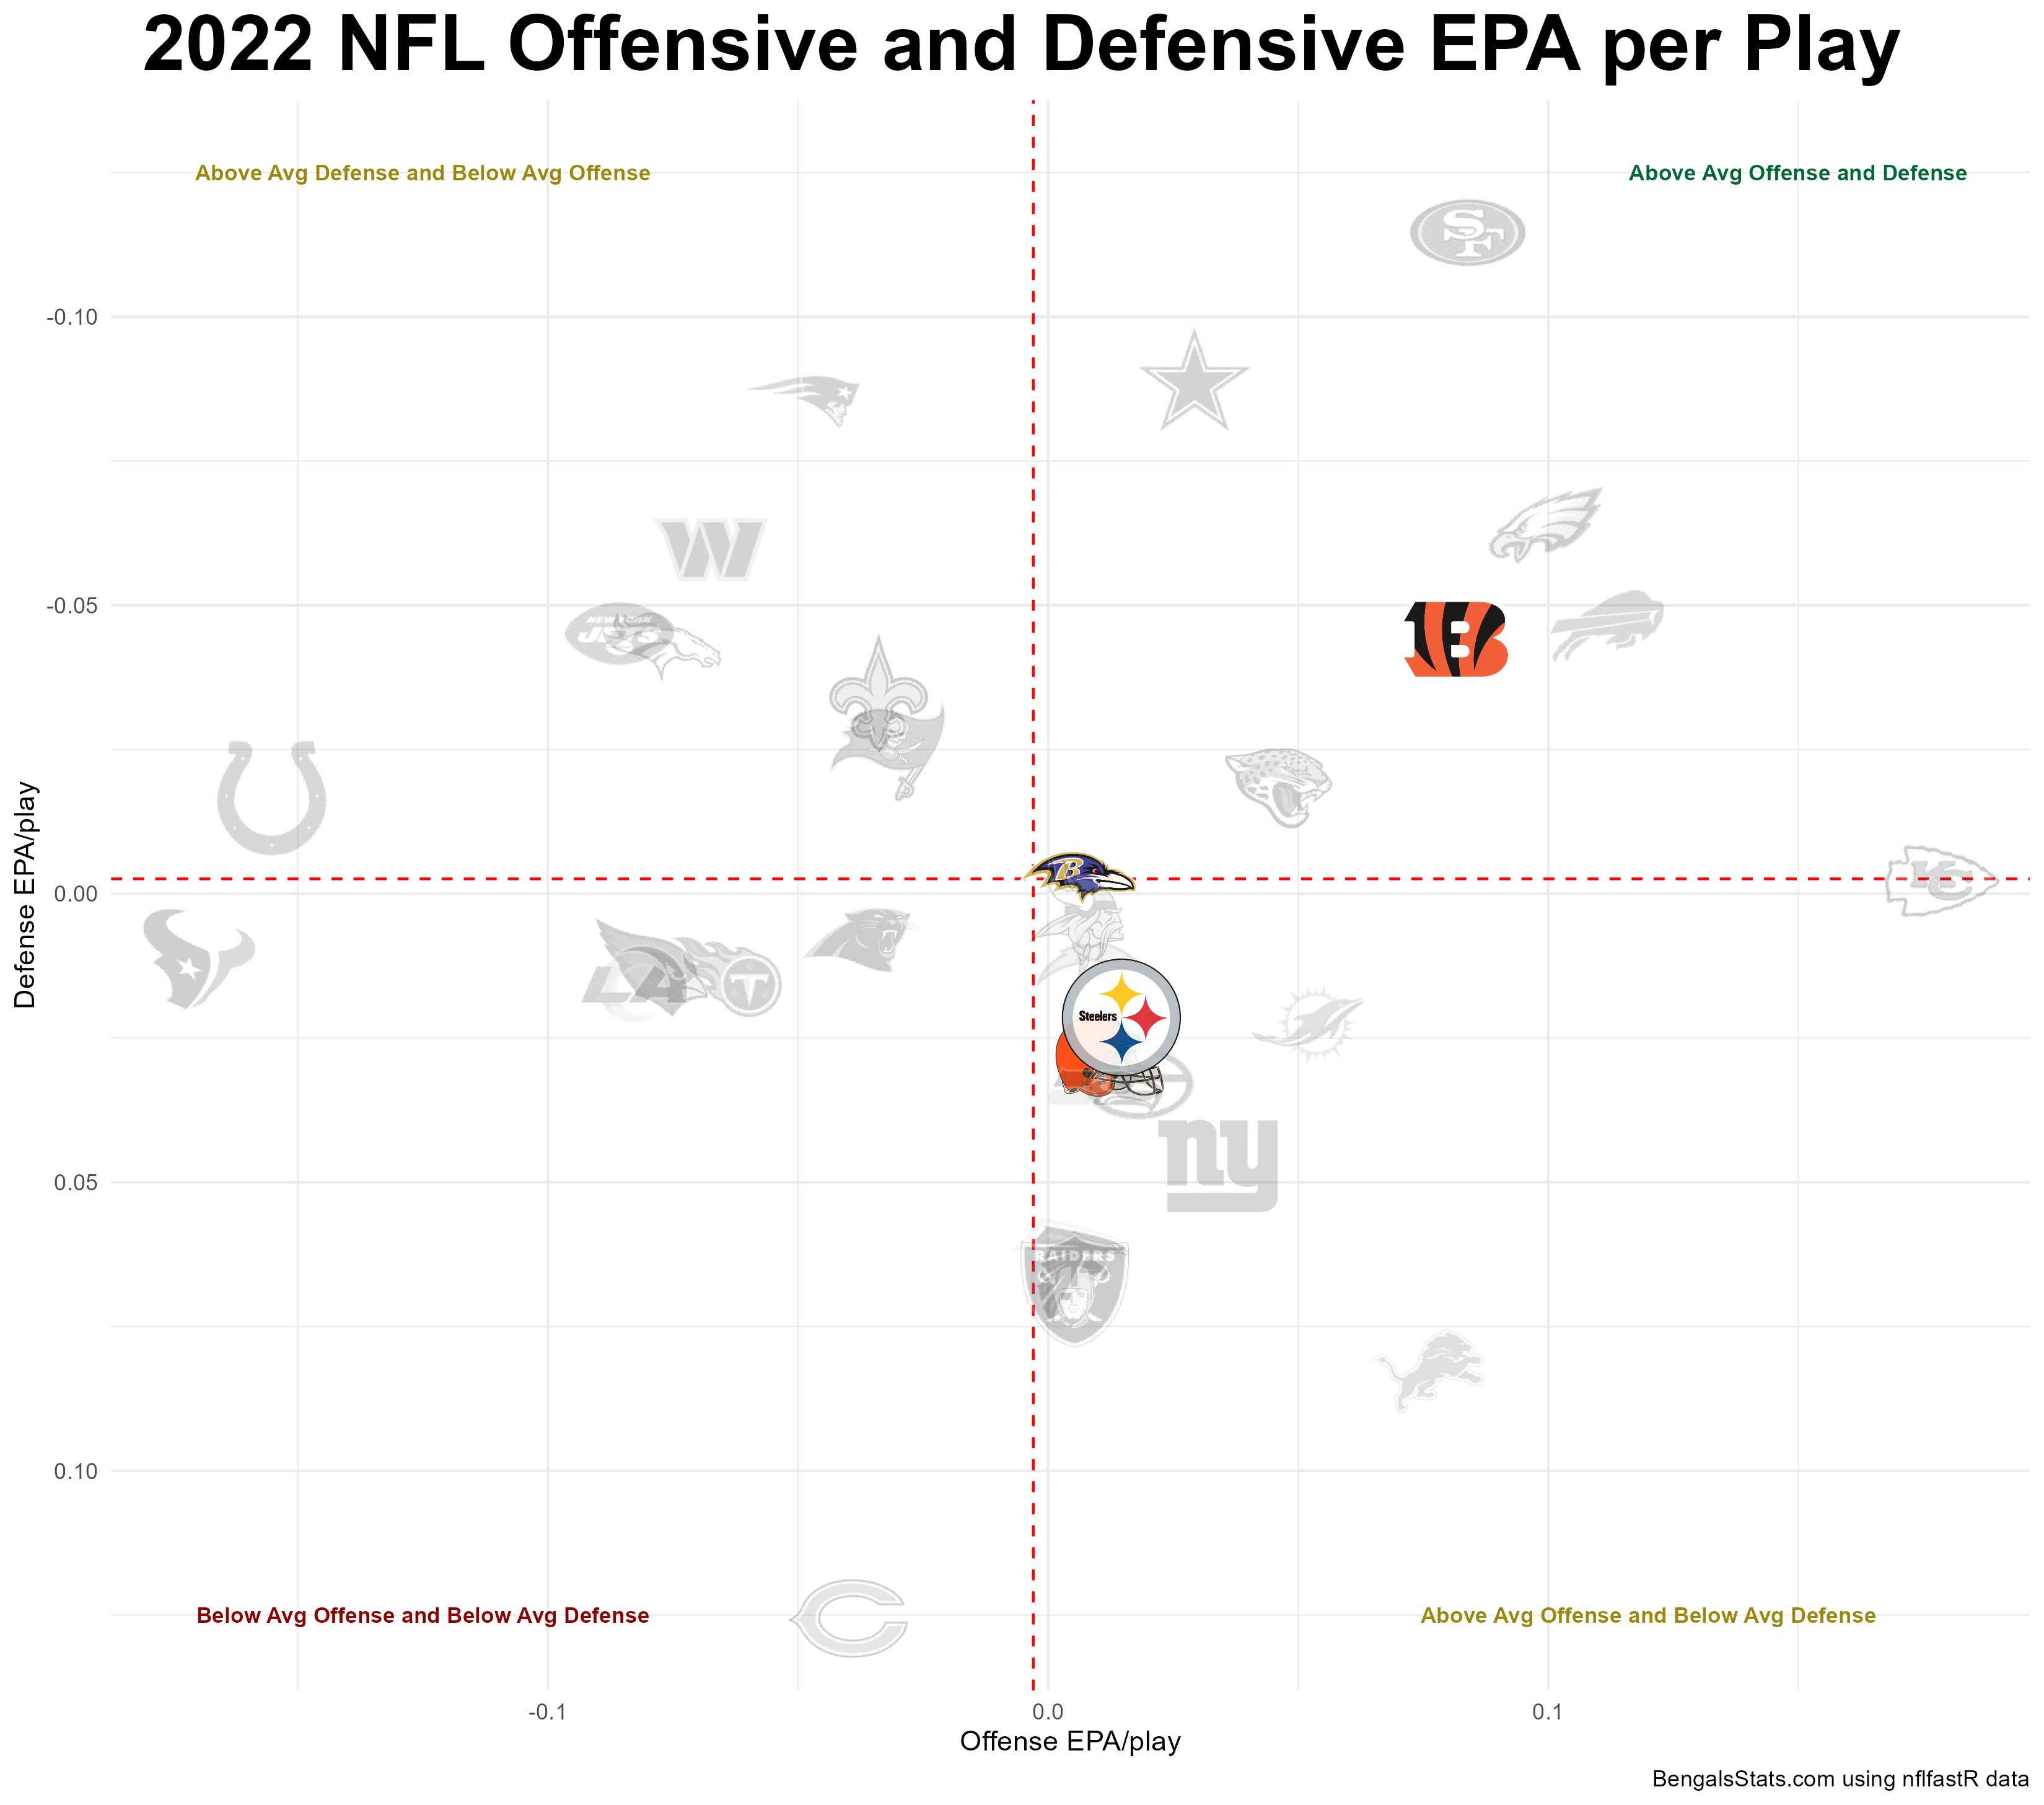
Continuing in the same direction during the 2022 season the Bengals took another step forward with an improved OL and more experience.
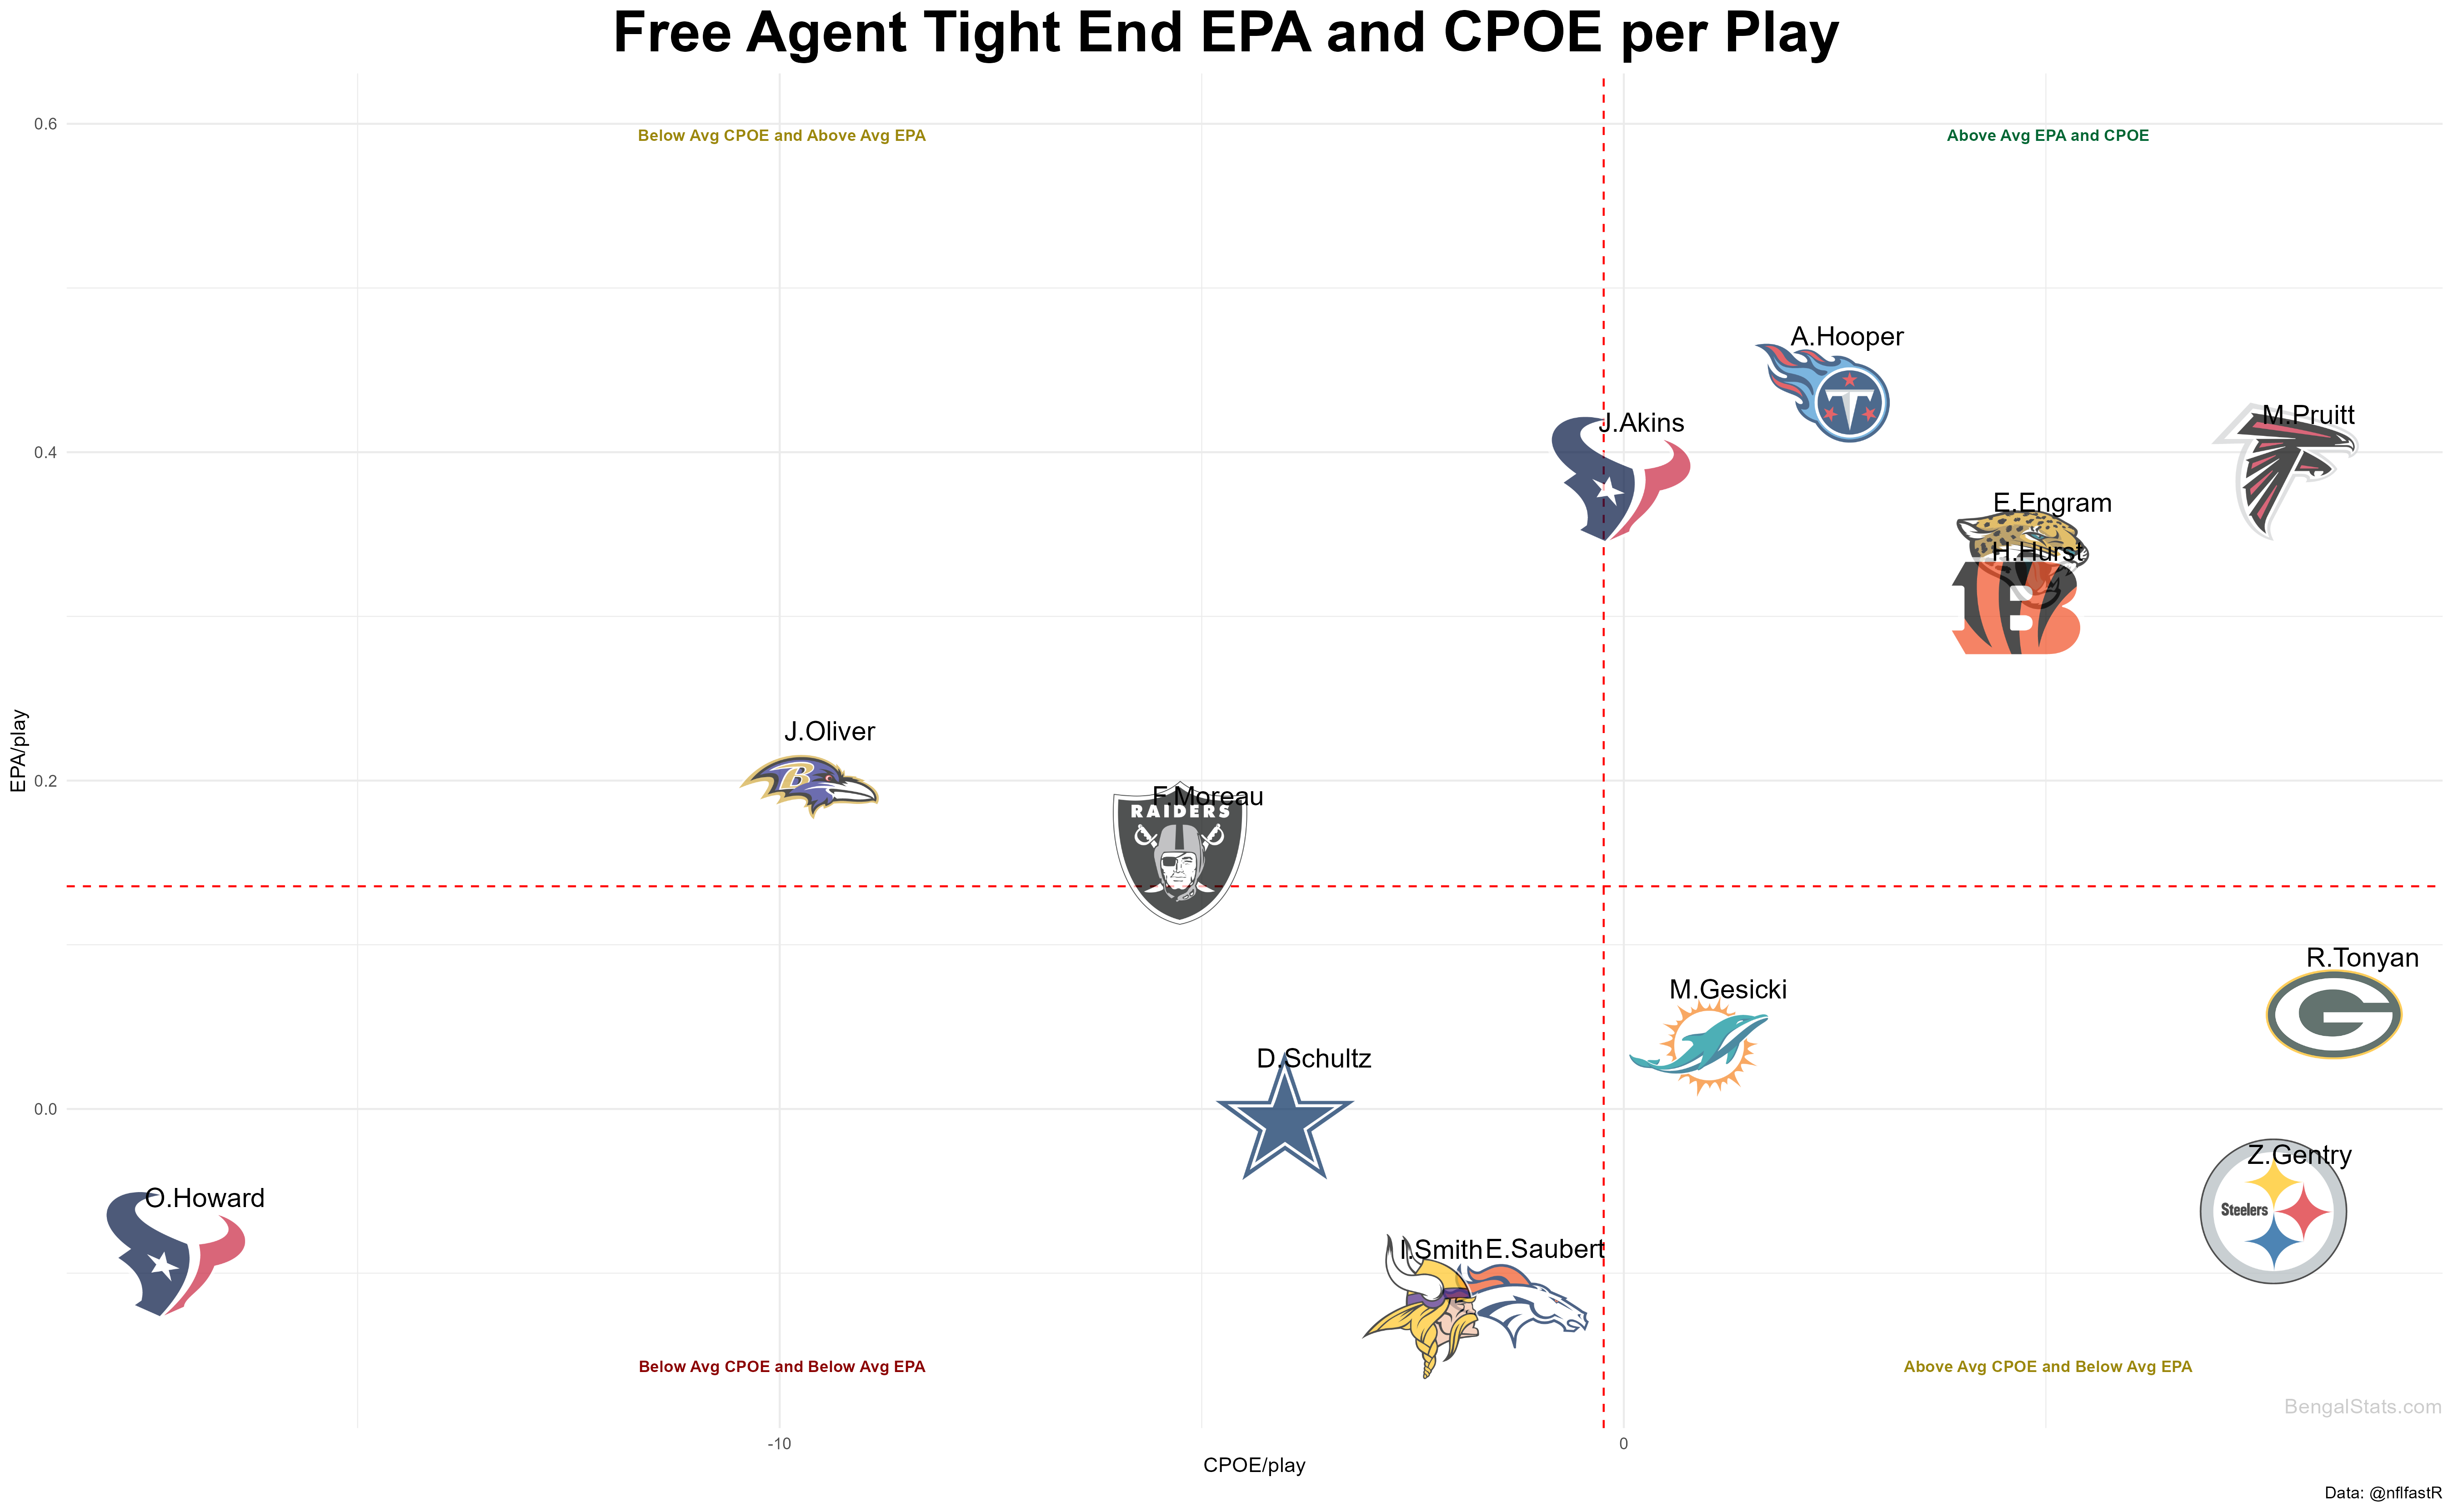
Top Free Agent Tight Ends in 2023
As free agency approaches let's take a look at a selection of FA tight ends. Engram is likely to be tagged and Hurst performed well but will he prioritize chasing a ring over maximizing his next contract?